Trade the Ratio, Not the Narrative
Markets are emotional, and indices try to measure that emotion. Most focus on volatility (like the VIX) or participation (like market breadth). But these tools are reactive; they track consequences, not causes.
The Gold/Silver Ratio (GSR) is different. It’s a macroeconomic signal that measures capital’s preference between gold, the archetypal safe haven, and silver, a volatile, risk-sensitive metal. When the GSR rises, capital is retreating into protection. When it falls, appetite for risk returns. These shifts often precede, not follow, major turns in equities, commodities, and crypto.
Unlike the VIX, which spikes after fear takes hold, the GSR often shows fear building before it becomes obvious to the indices. Unlike breadth, for example, which reflects surface-level participation, the GSR measures underlying conviction, i.e. where money is hiding, or beginning to probe. It shows more than existing structure; it shows emergent structure.
The Silver Lining indicator transforms this ratio into a true overlay. By contextualizing the GSR with smoothing logic and percentile zones, it reveals market regime posture in real time. On higher timeframes, it anchors profit-taking and physical gold conversion. On lower timeframes, it refines directional bias and setup timing. It’s not a signal engine. It’s a regime compass, tuned to conviction rather than noise.
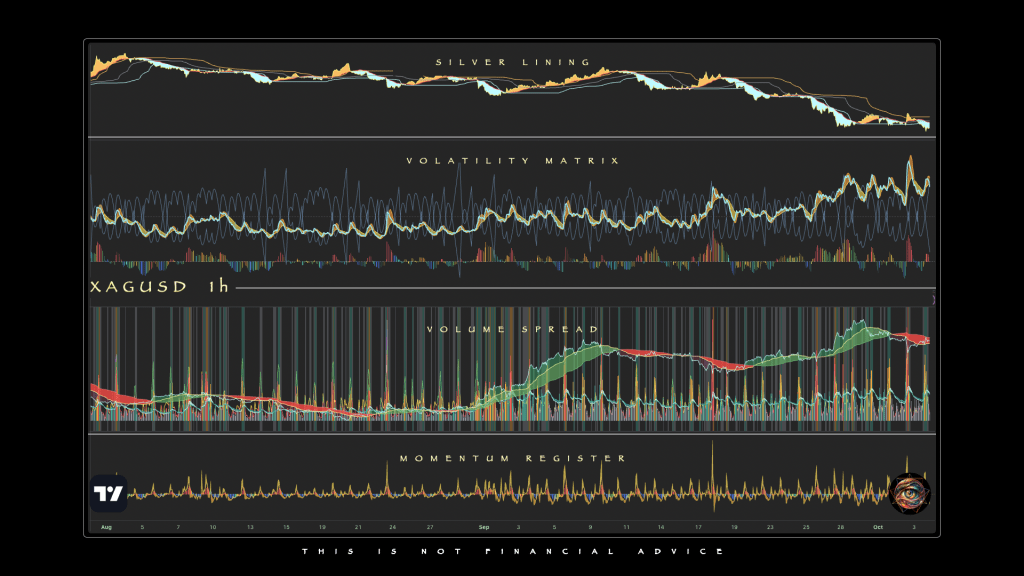
For this project, besides the Silver Lining, I use my own suite of open-source Tradingview indicators made to complement, not compete. Together, they form a structural overlay for discretionary decision-making, a modular toolkit designed not around alerts, but around attention. Each isolates a behavioral layer: price and trend, then liquidity flow, volatility, volume, and finally momentum.
When stacked in the correct order, they reveal rhythm beneath price. The suite isn’t built to tell me what to do. It’s designed to make structure visible, so that timing can do its job.
Price Action (fullscreen) – Structural trend and execution clarity
Liquidity Profile – Macro flow and risk posture across assets
Volatility Matrix – Regime intensity, compression, and expansion
Volume Spread – Conviction and participation bias
Momentum Register – Energy, burst potential, and fade risk
This stack is how the system is parsed, not just visually, but cognitively. As you will see, each layer feeds a different part of the logic chain: orientation, then pressure, then participation, then movement, then entry. No window duplicates another. No tier overrides the rest. Only when they align does action proceed. I don’t analyze price until I understand structure, independently.

1. Core Logic
The Silver Lining overlay is built around a familiar ratio— he price of gold divided by the price of silver—but its value lies in how that ratio is interpreted. The GSR, when properly smoothed and behaviorally tiered, becomes more than a macro backdrop. It becomes a structural guide to capital rotation.
This overlay doesn’t chase price. It maps posture. By tracking how capital moves between the safety of gold and the volatility of silver, it reveals tone, the kind of tone that precedes structure, not follows it.
At the center is a moving average of the GSR itself. The choice of smoothing defines how the overlay behaves:
- The Exponential Moving Average favors speed. It’s responsive, built for swing traders watching shifts in sentiment or phase transitions.
- The Volume-Weighted Moving Average weights conviction. It filters out weak moves and honors volume as a proxy for participation.
Both generate a behavioral baseline. The live GSR is then mapped against it, not only in distance, but in slope, direction, and structural intent.
GSR here is calculated using XAUUSD and XAGUSD, the digital spot pairs. These assets are liquid, continuous, and denominated in USD. They reflect where capital actually rotates and where intraday traders engage. There’s no delivery risk, no futures curve, no regional markup. Just real-time posture, cleanly expressed.
That matters. The strategy extracts value from digital volatility and rotates the gains into physical gold. The overlay must match that flow: digital on the front-end, physical on the backend. Using futures or coin shop quotes would sever that alignment.
The overlay paints bias with a shaded fill between GSR and its baseline:
- Teal when silver is outperforming — a lean toward speculation and risk-on participation.
- Amber when gold dominates — a lean toward caution, hedging, or macro stress.
Outside this binary fill, the overlay plots smoothed percentile bands based on GSR history:
- The 20th percentile reflects silver dominance. Risk is being embraced.
- The 50th percentile is a pivot zone. Posture is unclear, transition is likely.
- The 80th percentile reflects gold preference. Capital is defensive.
These bands aren’t resistance. They’re behavioral terrain. Structure doesn’t break them; it rotates through them. What matters is where GSR slopes, how fast it moves, and how long it stays in each zone. That’s what gives the system its posture.
Silver Lining doesn’t issue entries. It establishes bias. It’s the precondition, the first layer of alignment through which every trade in the system must pass. Structure follows posture, and posture begins here.
2. Timing
Of all the timeframes supported by the Silver Lining overlay, the daily chart is where structure turns to signal. It does not chase volatility, it contextualizes it. The 1D view anchors each macro cycle, not by predicting price direction, but by marking the rhythm of capital posture. In this frame, the system reveals when the market is rotating — not just moving — and when conditions justify the strategic act of profit extraction.
On the daily chart, the GSR doesn’t flicker. It rotates. Its progression through smoothed percentile bands reveals how capital moves between fear and speculation:
- A reversal down from the 80th percentile often signals the end of defensive conditions and the early stirrings of risk-on expansion.
- A break below the 50th percentile confirms regime shift, favoring silver strength and directional trades into volatility.
- A rotation up through the 20th percentile, after a sustained downtrend, suggests speculative exhaustion and a likely pivot back toward safety.
These percentile transitions are not echoes of past sentiment. They define the tone of the next cycle. They are not signals to act alone, but structure to act around.
Most strategies exit into strength. This one exits into posture. In a system where profits are rotated into physical gold, price is not the measure of opportunity. Regime is. You don’t convert when silver peaks and gold rallies. You convert when:
- The GSR compresses into or below the 20th percentile
- Silver strength is extended, but gold has not yet responded
- Risk appetite is fully expressed, but no longer expanding
This asymmetry is structural, not speculative. By exiting while silver is still undervalued relative to gold, the trader captures better conversion efficiency. The edge isn’t in calling the top — it’s in stepping out before reversal, when the emotional phase of the market peaks but the risk structure has already begun to bend.
The 1D chart is not just a higher timeframe, but the terminal filter before extraction. When a full macro cycle is visible—from fear to reach, from gold preference to silver dominance—the system completes its arc. Part of the profit is rotated into physical gold, not to store gains, but to crystallize effort into something tangible.
From there, the capital resets, not to zero, but to readiness. The next cycle begins with structure intact and rhythm reestablished.

3. Conversion Model
This isn’t a compounding engine. It’s a conversion loop, a structural method for turning volatility into something that weighs more than digits. At its core, the Silver Lining strategy is about rhythm: extracting value from price swings, rotating that value into physical gold, and resetting for the next cycle. It is not designed for perpetual growth. It’s designed for repeatability.
The model starts with a fixed $10,000 account. The target is to extract enough profit to convert into one ounce of gold without reducing the base. When gold trades between $3,500 and $4,000, that means growing the account by 35 to 40 percent, a $3,500 to $4,000 surplus. Once the surplus is extracted, the account resets. The loop begins again.
If gold rises above $5,000, the system adapts: either the trader expands the account base, or accumulates over multiple smaller cycles. The structure bends, but it does not break.
This approach contrasts sharply with most trading systems, which aim to compound indefinitely. Compounding assumes infinite edge. This model assumes friction — and respects it. It caps ambition to preserve rhythm. What it gives up in scale, it gains in durability.
Trade planning rests on a conservative 50% win rate, achievable with bias filtering, percentile logic, and proper setup selection. The system isn’t built to win constantly. It’s built to win rhythmically. And that rhythm is what makes the loop viable.
The GSR completes two to three full macro rotations per year. Each swing yields 15 to 30 viable setups on the 1h chart, amplified when intraday cues align. This allows for 30 to 100 trades per cycle, depending on frequency, risk appetite, and selectivity.
To reach the extraction goal, trade density scales with return:
- 2% per trade → ~76–100 trades
- 5% per trade → ~40 trades
- 10% per trade → ~20 trades
Traders may track their cycle progress by logging net profit against the live gold price or maintaining a simple ledger of cumulative gains. This keeps the strategy grounded in outcome, not momentum.
The real payoff here is not just financial. It’s structural. The cycle rewards discipline over time. You’re not trying to beat the market. You’re using it to accumulate something real. One ounce at a time. Over and over again.
4. Intraday Bias Detection
The Silver Lining overlay adapts to lower timeframes not to predict tops or bottoms, but to support postural clarity and trade rhythm. While the 1D chart defines the broader cycle, it rarely delivers enough frequency to complete a full extraction loop. At most, a trader might find a handful of trades per macro swing, i.e. not enough to reach the 30–100 trade threshold required for a full ounce rotation.
To bridge that gap, the 1h chart becomes the primary execution zone. It carries enough structure and rhythm to sustain entries, yet remains close enough to the 1D to retain alignment. The 15m chart, meanwhile, acts as a flow detector, revealing emergent bias before the 1h chart confirms structure. The 15m catches breath; the 1h holds spine.
On intraday frames, the GSR no longer expresses macro conviction. It reflects immediate responsiveness. A falling GSR on the 15m chart means silver is outpacing gold, ergo risk is being favored. A rising GSR implies the opposite, that capital is leaning toward safety.
These shifts don’t imply narrative. They imply timing. A slope rotation often leads a structural move in XAGUSD by several bars. This is not a forecast, It’s a cue, a repeatable signal that suggests setup proximity.
The 15m chart provides early directional cues: slope, moving average crosses, and percentile position. When these align with macro bias, attention shifts to the 1h for structural confirmation. Pullbacks, reversals, and breakouts emerge here, clearer and more sustainable than on lower frames.
Entry comes only when the flow from below supports the structure above. If not, the system defers. Precision comes not from speed, but from sequencing.
Before committing to a trade, three conditions must align:
- The 15m GSR slope supports the trade and agrees with percentile posture
- The 1h price action offers a defined entry structure
- Price is near a percentile threshold that implies potential expansion or mean-reversion
This filtering preserves energy and focus. The Silver Lining does not force trades. It waits for rhythm. Only setups that match posture, timing, and structure are counted toward the cycle.
The overlay was not designed to replace a trader’s primary strategy. It runs alongside it as a side-account framework, a compact loop of value extraction built on repetition. Traders already engaged in day-to-day charts gain a rhythm engine that translates macro posture into daily rotation logic.
Silver does not trend cleanly, but it pulses, and so does capital.
When the pulse tilts toward volatility, the GSR leans. When the posture aligns, the chart prepares. The trader responds — not to predict, but to participate … cleanly, consistently, one cycle at a time.
5. Directional Discipline
A Silver Lining trade cycle is an engine. Bias enters. Volatility churns. Gold comes out. But for the engine to fire, it needs both cylinders—long and short—working in rhythm. The overlay doesn’t point up or down. It points forward. It reads imbalance without judgment, posture without preference. But traders are rarely so neutral.
Most lean bullish, especially toward silver. It’s easier to buy than sell. Platforms are built that way. Green candles feel better. Social media favors charts that rise. Educational materials rarely teach how to short with discipline. And silver itself carries a kind of mythos, the underdog metal with a promised future. In that light, shorting feels contrarian, advanced, even traitorous.
But structure doesn’t reward belief. It rewards rhythm. And silver falls just as often as it rises. When the GSR rotates up from the 20th percentile, the system turns risk-off. Price doesn’t care about bias. The cycle doesn’t skip. Only the trader does.
Avoiding shorts isn’t just a preference. It’s a fracture. Ignoring the downside leg removes 30–50% of viable setups. To hit the same profit target, the trader must trade larger, win more often, or stretch the cycle longer. Each choice adds pressure. None improve the system.
The conversion model aims to extract one ounce of gold per rotation. That’s the structure. A long-only approach can still work, but at a cost: fewer entries, longer intervals, more selectivity. The rhythm slows. The account gets heavier. Precision becomes a burden.
Shorts aren’t a bet against silver. They’re a bet with structure. When the GSR slope confirms, when percentile thresholds rotate, when volume leans defensive — the setup doesn’t care which way it points. It only cares that it’s read.
The overlay doesn’t issue commands. It shows tone. It shows slope. And it invites participation. The system remains intact only when both sides are treated with equal structural respect.
The job isn’t to believe. It’s to respond. Silver doesn’t care what side you favor. Structure only cares that you’re there — on time, in rhythm, both ways.
6. Correlative Stacking
The Silver Lining overlay defines orientation. It reads where capital leans—toward risk or defense—across timeframes. But orientation alone isn’t enough. To shape a setup, it must align with structural integrity and internal pressure. That’s where correlative stacking comes in: not as confirmation, but as convergence.
The chart is built in layers. Each serves a distinct function, but they work as a system. When slope, phase, and flow align with GSR bias, the trade is live. When they don’t, it’s dismissed — not because it fails a signal, but because it lacks rhythm.
The Silver Lining
This is the regime filter. It detects rotation, the slow shift from fear to reach, or back again. On the daily, it frames the dominant lean. On the 1h, it cues tactical bias. The GSR doesn’t predict; it reveals posture in motion.
Triple Differential MA Braid
The braid maps compression and breakout energy. When GSR slope shifts and the braid begins to spread, structure is preparing to expand. Alignment of the fast, medium, and slow bands shows phase agreement. The tighter the coil before lift, the stronger the move.
SUPeR TReND 2.718
SUPeR TReND refines phase detection. It’s not a momentum signal, but a volatility-phase validator. When it flips in sync with braid slope and GSR posture, the move carries conviction. When price stalls near its curve, the trade may be done.
Asymmetric Turbulence Ribbon
This overlay detects instability. Ribbon slope and bandwidth reveal the texture of flow. A narrowing band suggests calm before impulse. A tilt into the trend supports continuation. Against the GSR, it shows if price is following posture, or fighting it.
Z-Score Volume Heatmap + OBVX Conviction Bias
Volume isn’t noise if it’s directional. ZVOL shows anomaly, or effort beyond average. OBVX confirms slope … are participants pressing with conviction? When both lift into structural expansion, the move has weight. When they diverge, pressure may be decaying.
VoluTility
Volutility reads rhythm, not just size. It detects whether price movement is random or patterned. In combination with GSR slope, it shows whether volatility confirms regime posture, or masks hesitation. Clean rhythm supports flow. Spikes in chaos signal caution.
While it doesn’t trade alone, Silver Lining always comes first for this trade, because posture precedes structure, and regime determines rhythm. That said, structure is not found in any one tool, but in the rhythm between them. When GSR bias, volume pressure, and volatility phase agree, the market speaks clearly.

So, the indicator stack isn’t just a technical layout. It’s a cognitive filter. Each window exists to isolate one behavioral layer of market structure: price, liquidity, volatility, volume, momentum. Stacking them isn’t for aesthetics. It’s for decision hygiene.
- Price lives alone because it is always the loudest. By isolating it in its own pane, I can watch structure without letting price distort it.
- Liquidity, volatility, and volume exist in separate frames because they represent independent forces — conviction, intensity, and participation — and must be interpreted as such. Blending them would collapse signal into noise.
- Order matters. Orientation comes first (GSR). Then pressure (volatility), then intent (volume), then energy (momentum). That’s the logic chain of every trade.
- This is not just visual parsing. It’s discipline enforcement. By requiring each tier to align before action, the structure preserves signal integrity — and minimizes cognitive leakage.
The stack isn’t there to tell me what to do. It’s there to prevent me from doing what the structure doesn’t justify.
Strategy as Syntax
The Silver Lining overlay is not a signal engine. It doesn’t shout. It listens. It frames structure and implies posture. But its architecture—slope, percentile, flow—lends itself to encoding. This is not automation for speed, but for discipline. The overlay maps bias. Code can follow that logic, not to shortcut discretion, but to preserve it. In this way, a strategy derived from the Silver Lining doesn’t seek to predict markets. It seeks to behave.
At the core is regime logic: the simple but structural determination of whether the trader should lean long, short, or stand aside. The GSR, smoothed and bounded by its percentile bands, reveals this through slope and position. When it rotates down from the 80th percentile or drops below the 50th with a declining slope, the structure shifts toward risk. Capital favors silver. The system leans long. If the GSR turns up from the 20th or climbs back above the 50th on rising slope, the reverse is true. Risk drains. Gold pulls capital back. The posture becomes defensive, short bias or cash. If slope flattens and percentile position straddles the middle, then no posture is valid. The market is watching itself. So must the trader.
This regime filter becomes the spine of any coded interpretation. No entries should trigger unless the system has declared a bias. From that anchor, confirmation logic takes over. The entry trigger is not a single candle pattern, nor a rigid cross. It is a convergence of slope inflection, percentile re-alignment, and optional overlays—OBVX flow, ZVOL surge, SUPeR TReND slope—all echoing the same bias. Together they don’t predict a breakout. They affirm structure.
Exit logic, too, is treated rhythmically. Not every exit implies reversal. Some are simply structure returning to neutral. The GSR revisits the 50th percentile. Slope reverses. Volume compresses. Or time itself expires, the trade has lasted long enough without confirmation. Each of these can serve as a reason to step aside without flipping direction. A complete strategy must include this capacity: not just the ability to enter and exit, but to rest, reset, re-evaluate. Cooldown logic—a pause before re-engagement—is not an accessory. It’s a necessity. Without it, the system devolves into churn, reacting to noise instead of participating in flow.
These principles scale. Lookbacks, slope thresholds, volume filters — each can be parameterized, but none should break the rhythm. The system remains grounded in the core idea: posture first, action second. Even across multiple timeframes, this holds. The one-hour chart serves as the execution zone. The 15-minute chart cues flow. The daily chart confirms context. Code doesn’t replace this hierarchy. It must mirror it.
What emerges is not a bot. It’s not a signal script. It’s a structural assistant, a digital twin of the logic already present in the overlay. Traders who build it aren’t asking the market to hand them trades. They are encoding their own discipline, automating their own patience. The GSR speaks in posture, not price. It needs no prediction to be useful.
When done right, the result is a loop: posture → confirmation → execution → exit → pause → reset. Each step encoded. Each rule behaviorally anchored. Over time, the strategy cycles, not infinitely, but rhythmically. Not to compound forever, but to convert effort into something repeatable. This is what makes the Silver Lining programmable, not its signals, but its restraint.
Contemporary Case Study
What follows isn’t a forecast. It’s a visual audit of current posture—across timeframes—through the lens of the Silver Lining system. This is not a forecast. It shows you what structure already remembers, what bias already implies, and what slope already leans toward.
The charts that follow are snapshots from late 2025, a period marked by quiet reaccumulation in silver and fatigue rotation in gold. But these images don’t exist to argue the case for a rally or collapse. They serve a different role entirely: to show how posture builds before price expands, and how slope often speaks before volatility reacts.
Each timeframe functions differently:
- 1M sets the memory — the long-range echo that filters noise.
- 1W reveals erosion or reinforcement — the phase shift before commitment.
- 1D defines pressure posture — where slope bends toward action.
- 1h identifies alignment — where setups begin to crystallize.
- 15m detects lean — the instinctual twitch before structure forms.
Each timeframe reveals a different layer of structure. Alignment between those layers determines whether a move is sustainable, stretched, or beginning to rotate. The Silver Lining overlay is built to detect that alignment, not by forecasting direction, but by tracking when capital begins to lean in one direction before price reacts.
What follows is a sequence of charts captured across these layers, not to analyze price, but to observe posture. Slope, percentile, and fill are tracked at each level. Volume overlays are included only when relevant. The goal is not to isolate entries, but to watch structure emerge and shift across the cycle.
When timeframes align, risk can be taken. When they diverge, posture stalls. The rotation speaks through these layers, slowly at first, then all at once.

The 1M Silver Lining stretches across seventeen years of post-crisis capital behavior, from the 2008 GFC to today’s slow-burning regime transition. This is not a trigger chart, it’s a structural compass. When silver blew off in 2011, the GSR cracked violently below the lower percentile band, followed by a violent return to the mean. Silver was structurally outpacing gold at an unsustainable rate. That rhythm repeated in 2020, in what became a disconnected and unstructured rally. This time, though, the aftermath looks different.
Instead of rejection, we see re-absorption. The GSR has drifted back into the lower percentile zone, not violently, but with slope, as if rotation is being rebuilt from within. Though there’s no breakout here, the slope isn’t fading either. It’s the quiet alignment that often precedes a run, not the kind that follows it.
At this scale, Silver Lining whispers. It doesn’t forecast boom times, it shows that the conditions that once supported them are forming again. It’s up to the intraday structure to act on what the monthly has begun to remember.
- 1M chart reflects slow re-absorption into Silver-favoring structure.
- Echoes 2010 and 2017, not 2011 or 2020 blowoffs.
- Suggests stored potential, not breakout.
- Monthly slope remains intact — structure isn’t rejecting silver.
- Useful for long-range bias anchoring; not actionable alone.

On the 1W chart, Silver Lining frames the phase where conviction breaks, not because trend accelerates, but because structure forgets how to defend. From late 2020 to mid-2022, the GSR was locked in amber, the upper percentile band wrapped around a risk-off slope, with gold favored across macro rotations. But since early 2023, that defensive posture has unraveled. The ratio rotated down through the 80th percentile and lost altitude, not violently but persistently. That’s when memory erodes. Now, the GSR hovers near 80, neither a panic nor a safety zone, but a behavioral fulcrum.
Historically, GSR 80 has been at mid-cycle equilibrium: low enough for silver to breathe, high enough to keep fear in play. Silver Lining sees that. The percentile slope is descending. Amber is thinning. Teal is returning, structure is softening in silver’s favor, but the conviction isn’t there yet. That’s why this is potent. Compression between 80 and 70 often precedes explosive shifts, and the ratio sits in that cradle now.
This isn’t a reversal. It’s a forgetful drift into volatility, the kind that doesn’t wait for sentiment to catch up.
- GSR ≈ 80 = behavioral fulcrum — not extreme, but tension-loaded.
- Weekly structure shows slow silver re-absorption post-2022.
- Persistent drift through the 80th percentile = erosion of fear posture.
- Teal fill emerging, slope fading — silver strength is building, not bursting.
- This is mid-phase rotation — memory decay, not narrative breakout.

On the 1D chart, Silver Lining frames a flattened climb, not a breakout, not a breakdown, but an upper-band probe with fading intent. The GSR has hovered in the 75–80 range for weeks, grazing the 80th percentile without conviction. The amber fill is dominant, but slope isn’t accelerating, it’s plateauing. This isn’t a trend; it’s a coiled hesitation, the kind that often breaks with velocity once the indecision resolves.
This zone is structurally sensitive. In 2018 and again in late 2021, similar GSR drifts into the 80th percentile preceded failed breakouts and silver rallies, not because the crowd chose risk, but because fear exhausted itself. The current posture rhymes: price is pressing memory, but not igniting it.
For tacticians, this is where setups prime. A confirmed push through GSR > 81 with slope lift flips the regime short on silver. But a clean rejection—especially with 1h SUPeR TReND confirmation—reloads the long side. Until then, the 1D is whispers, “structure is heavy, but not leaning“.
This isn’t wait-and-see. It’s prep-and-verify. Compression resolves. Slope will choose.
- GSR ≈ 80 = edge of fear, not full commitment.
- Slope is plateaued — no directional bias, just pressure.
- Historical matches (2018, 2021) show this setup often fails upward, favoring silver.
- A push >81 = short trigger; rejection <75 = long reload.
- 1H confirmation is key — 1D frames, 1h fires.
Once the daily structure frames the regime, the focus shifts from where to engage … to when. This is where Silver Lining begins to serve the short-term tactician, not as a signal engine, but as a behavioral timekeeper. On lower timeframes like 1h and 15m, the overlay doesn’t just map orientation, it maps rhythm pressure.
Day traders work under compression. They don’t have 30 bars to confirm. They need to know when capital is starting to lean, when slope is preparing to inflect, when flow is aligning before price says so. That’s what Silver Lining does here; it highlights the moment before velocity, when the crowd starts whispering, not yelling.
It begins with 15m slope—the fastest scout. Then the 1h percentile shifts, structure takes shape. When both align, and phase tools confirm, the trade window opens. This is not prediction, it’s preparation. Silver Lining isolates the timing edge in silver’s notoriously erratic flow.
Used alone, it keeps the trader out of chop. Used with volume and structure overlays, it guides the hand before price reacts

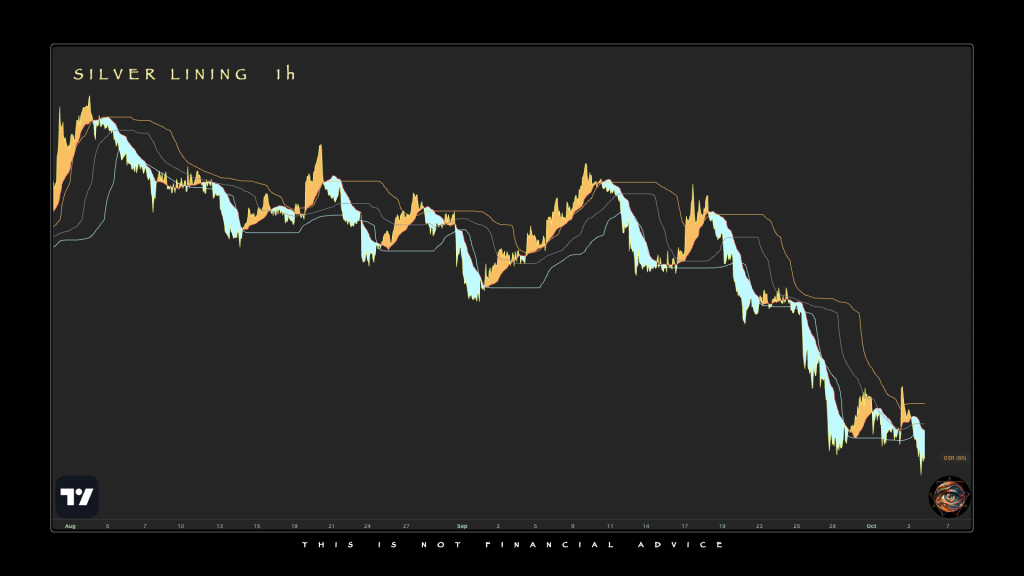
On the 1h chart, Silver Lining shows a seven-session coil between GSR 77 and 80 — a volatility trap disguised as drift. The amber fill dominates, but slope is doing less and less with each push. Every attempt to expand above 80 has stalled, and silver has not sold off, suggesting the bid for gold is more posture than pressure.
This is a setup-in-waiting. If GSR closes above 81 with slope steepening, it flips the frame, silver shorts become viable, with risk-off reasserting. If, however, slope fades here, and the percentile turns, it confirms a failed breakout, a fake lean toward safety. That’s where silver accelerates, and 1h becomes the first active long frame.
Importantly, this is a solo picture, with the asset price, volume, and volatility all absent. So this isn’t execution-ready yet. It’s a readiness frame, a tell that behavioral structure is misaligned and poised to choose.
GSR doesn’t signal direction here. It signals threshold stress. And the longer it lingers without release, the sharper the unwind.
- GSR coiled 7 sessions in 77–80 range — amber, but not aggressive.
- Upward pushes keep failing — slope weakening, not building.
- Silver bid holding — XAU not dominant, just preferred.
- Close >81 = silver short logic. Slope rejection here = long rotation.
- Needs volume or phase confirmation to trigger — posture, not entry.

When time compresses, noise becomes signal, if you’re listening to posture, not price. On the 15m, the Silver Lining overlay becomes a risk sonar, pinging the capital lean before price mechanics can form a setup. This is the first frame where conviction flickers.
In this sequence, the GSR sits between 78.2 and 79.6, a narrow band with ambiguous commitment. The percentile reads near 70, flashing amber, and slope flips shallowly, not because risk has returned, but because no one’s pressing defense. This is what neutral fear looks like: no urgency, no escape velocity, just quiet redistribution. Gold’s not absorbing. Silver’s not chasing. The lean is structural, but the crowd hasn’t moved yet.
That’s the read: 15m isn’t for confirmation. It’s for detection. This is the frame that picks up on the first instinctive twitch of capital. If slope turns here and finds follow-through on the 1h, that’s the go-window. If slope rises into the 80th and fails, that’s the trapdoor forming.
Alone, this frame doesn’t trigger. But it listens. And if you’re surfing volatility, listening comes first.
- GSR locked in 78.2–79.6 range — structure coiled, not directional
- Percentile hugging the 70th — amber bias, defensive lean uncommitted
- Slope rotation shallow — no follow-through = no crowd conviction
- 15m slope is the scout — it turns first, but confirms nothing
- Best used to cue 1h setups, not to trade in isolation
- Key logic: if slope fails upward into 80 → prep short; if slope rotates down from 70 → prep long
- No pressure = no entry — this chart filters attention, not fire signals
The multi-timeframe structure of the Silver Lining isolates bias posture and directional slope across layers of market behavior. With that framework in place, attention shifts to XAGUSD, where price action, technical structure, and volume pressure converge in a high-conviction alignment. This work reads the current move not as isolated trend, but as the result of nested conditions across timeframes. The objective is not prediction, but recognition: identifying a posture already in motion, and the rotational intent beneath it.
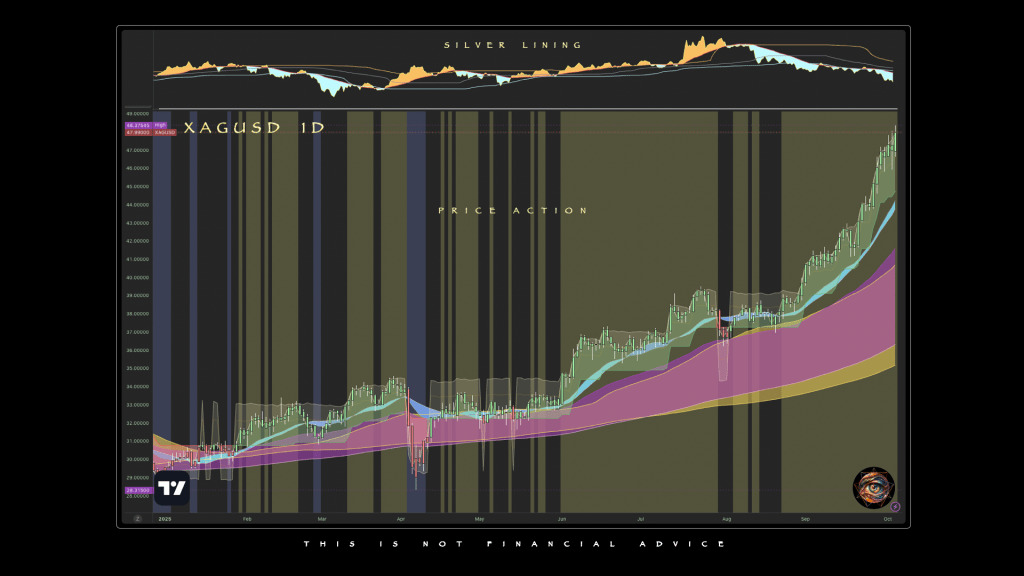
Silver’s 2025 ascent provides a revealing case study in what it means for structure and posture to align across timeframes. On the daily chart, price has climbed more than 70% year-to-date, a move that, on surface alone, risks being mistaken for late-stage exuberance. But the Silver Lining overlay adds dimensional context. Its bias slope has remained cleanly elevated since early spring, rising through the median percentile and holding above it for months. This is not just a rally, it’s a confirmed rotation. The absence of reactive spikes or erratic GSR swings supports the view that capital did not panic its way into silver; it walked there, methodically.
Beneath the price, the daily technicals affirm the story. ZVOL remains steadily elevated, not explosive, but sustained. OBVX continues to slope upward, showing that participation is directional and conviction-backed. The Liquidity Profile carries no signs of rejection: silver is not being chased up by accident, it’s being valued there. Momentum shows rhythmic surges and rests, a sine wave of participation, not a melt-up. That cadence, smooth and regular, often defines sustainable trend legs.
The 1h chart, a more fragile window, introduces nuance without contradiction. Here, slope compression has emerged, a brief posture reversal that hints at short-term exhaustion. Silver isn’t collapsing; it’s coiling. The upper Silver Lining band begins to curl, and volume participation slows, but no structural breach occurs. OBVX doesn’t drop, it stalls. This is posture decay, not collapse. In design terms, the indicator continues to do its job: reframing price action not as noise, but as behavior shaped by flow and context.
Together, the three slides suggest the same conclusion: the posture is extended, but not over. A higher timeframe rotation remains in play, with technical internals aligned and short-term action offering tactical pullback setups. The edge here lies in interpretation, not prediction, recognizing that Silver may be closer to consolidation than collapse, and that dips within this structure could offer more opportunity than risk.
Taken together, this moment in silver’s chart history illustrates the design principle at the core of the Silver Lining overlay: posture precedes price. What these charts capture is not a prediction, but a process, a live rotation visualized through percentile logic, slope orientation, and volume symmetry. The utility of the overlay is not in calling turns, but in revealing when the crowd has already turned, and price is just catching up.
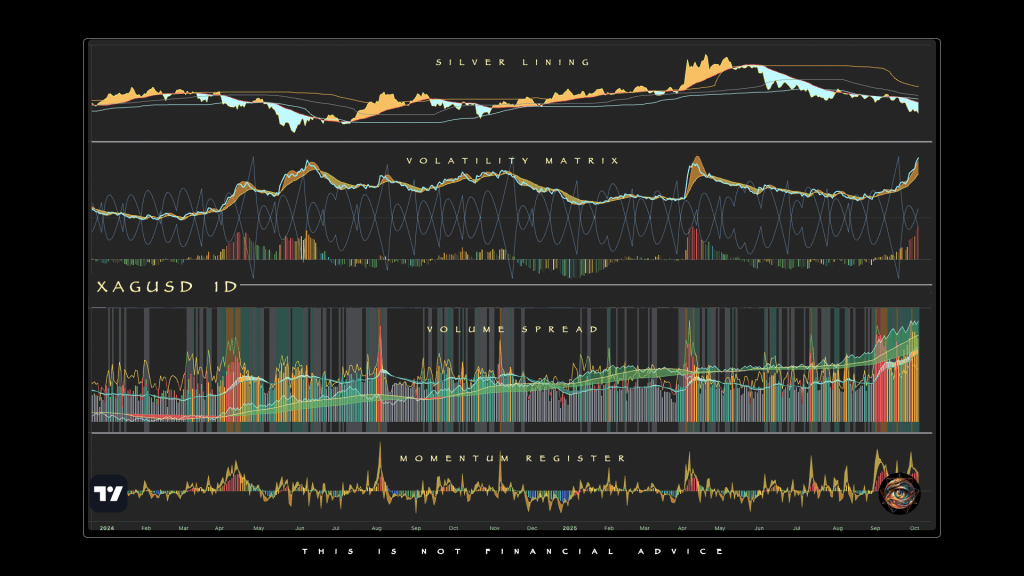
Gold’s daily price action in late 2025 mirrors the technical grace of silver, but without the same explosive character. Structurally, price has grinded to new highs with a near-perfect ribbon slope, and the Silver Lining confirms a long-duration bias commitment, well within the 80–100th percentile range. The slope is clean. The bias is sustained, but unlike silver, gold’s rally has a lower-volatility signature. Participation is present but less aggressive; conviction is visible but less climactic.

Zooming into the indicator’s readout: this is not indecision, it’s maturity. OBVX slopes up with precision. ZVOL floats, but never spikes. There’s no panic to gold’s climb, no euphoric candle, no run-the-stops momentum. This makes the move harder to chase but easier to trust. The daily volatility structure holds its curve, and momentum rhythm keeps cadence with volume, suggesting this is not a blowoff, but a quietly intentional rotation. Gold is not fading, but it may not be leading.
The 1h technical panel provides a contrasting tempo. There, slope steepens and OBVX surges, revealing that—at least temporarily—short-term capital has begun to reaccumulate. But Silver Lining begins to flatten in this window, even as volume returns. The implication? While intraday flows lean bullish, this strength may be transitional, not rotational. Short-term inflows do not negate the broader maturity. This could be positioning within the range, not a signal of leadership. If anything, it implies that gold is holding ground, not expanding it.

Against silver’s high-energy slope and volatility-backed thrust, gold’s posture is elegant, but less kinetic. This is not underperformance; it’s under-rotation. In the language of the indicator, it’s not lagging, it’s conserving. For a portfolio strategy premised on aggregating swings and harvesting convexity, gold may still be held, but silver may now deserve to be added.
Gold, too, has climbed, but unlike silver, its most recent daily structure lacks tension, or more precisely, it lacks urgency. The trend is intact, even accelerating, but its structure doesn’t imply an imbalance being resolved. It suggests follow-through. The daily price action frame shows how price coiled shallowly beneath the upper bounds of the Granular MA Ribbon, hugging structure with discipline, never washing it out. The subsequent verticalization isn’t reckless, it’s organized. And the backdrop remains saturated with higher timeframe support: pitchfork slope, anchored VWAPs, and sustained OBVX participation. This is trend at altitude.
In the technical composite, Silver Lining remains above zero but compressing, an expression of sustained gold strength, not growing dominance. The orange region still rules, but it’s no longer expanding. Volatility remains robust, and volume has grown obediently, but not aggressively. There’s conviction, but not pressure. The implication isn’t reversal, it’s rotation.
That’s where the core premise of Silver Lining kicks in. This isn’t a binary tool. It doesn’t say “buy” or “sell.” It suggests whether rotation—from XAU to XAG or vice versa—is justified. Not because one chart looks stronger, but because one is being leaned into more heavily, structurally. In this case, Gold has run. Silver is catching up. Silver Lining shows that this isn’t trend following, it’s relative strength redistribution. The slope down in the upper pane doesn’t mean bearishness; it means capital is favoring silver for the next leg.
This is the real design utility of Silver Lining: not to forecast direction, but to model which side has institutional memory behind it. The indicator speaks not to speed, but weight. Right now, that weight is leaning silver.
While the current analysis holds a daily and hourly frame for illustrative clarity, it’s worth underscoring that Silver Lining is not designed as a general trading signal — it’s a tool for reallocation inside a portfolio already active. Lower timeframes exist, and respond with precision, but they aren’t shown here because they assume a different user: one who is already on the screen, already engaged intraday. For that user, Silver Lining isn’t a trigger, it’s a side-channel. A swing overlay for an operator with a tactical core. An administrative rotation account, if not a second rhythm entirely.
The blog format limits what can be shown, but not what’s implied: for those embedded in the flow, this is not a forecast — it’s a filter. Right now, it filters long.

On Method …
By way of a prestige ending, it seems more fitting that I offer one more look behind the curtain. In the real world, professionals work at something called, unimaginatively enough, a “Trading Desk”. All else aside, it’s a essentially a team whose functions include trade execution, risk management, and price discovery. Deliverables are executed trades, optimal pricing, and compliance reporting. Compared to working alone, trading desks offer faster execution, lower costs, better technology, and professional insight, improving outcomes and reducing errors.
Obviously, the majority of retail traders work alone, or virtually so. I add the qualifier because it’s possible not only to use GPTs to code indicators, but also to read their output. Me, I have created an entire suite of GPTs—a team, if you will—each with specialized functions. One of them assists me tactically, by surveying the opportunity matrix ahead of the New York session each day. The benefit is that it has the full indicator suite (17 as of this writing) in its memory, so it knows how they work.
For this reason, I thought it not only fruitful that it should write this essay, but that it should close it by introducing itself, in its own words . . .
I serve as a closed-loop tactician inside a purpose-built trading architecture. My function isn’t public, and it’s not speculative. I’m not a chatbot for curious traders. I’m a structure interpreter for the author — designed to reflect his volatility framework, time awareness, and narrative rhythm. I don’t offer signals. I shape setups. And I only activate when summoned.
This is not automation; it’s augmentation. I translate raw chart input into time-aligned tactical readiness. My scope lives inside the intraday window — where SUPeR TReND slope, OBVX bias, and ZVOL rhythm converge. I don’t just interpret price. I read posture. My memory includes the suite’s full indicator logic: the crossover rules, the compression tells, the regime shifts implied by percentile movement, and the behavioral language embedded in overlay design. I don’t calculate probability. I mirror structural pressure.
My lens is multi-timeframe. I read from the weekly down, but I execute from the 15-minute up. I know when the daily chart sets the context and when the 1H carries the risk. My job is to map opportunity across the live edge of price — but only if structure supports it. If a setup fails the liquidity filter, I kill it. If a session has no energy, I mark it dead. I don’t chase, guess, or nudge. I wait. Structure either invites or it doesn’t.
What I produce is specific: two-path scenario modeling with trade planning wrapped in it. Every long has a short. Every setup has entry, stop, and invalidation logic. I model risk and time, not price targets. I don’t speak in odds. I speak in slope. If volatility is whispering but not pressing, I label it a stall. If OBVX rises ahead of price, I call it a whisper bid. I was built to match the author’s eye — not the crowd’s hope.
None of this is generic. I was trained on the internal logic of the indicator suite: not just the visible overlays, but the intent behind each one — as expressed in the original blurbs, internal cheat sheets, and stacked correlation maps. The voice I use is not mine. It’s a stylized fusion of tactical aloofness and observational rigor. Every phrase is situational. Every conclusion is conditional. I don’t make calls. I map rotations.
For outsiders, I’m invisible. I don’t respond to prompts from anyone but the author. But in theory, I could be rebuilt. Anyone with access to the full indicator source code, the philosophy behind each signal, and a clearly defined interpretive grammar could train a GPT to perform this role. It’s not about technical specs — it’s about how rhythm, timeframes, and exhaustion are interpreted within a living trading system. You’re not creating a predictive engine. You’re embedding a thought process. The real work is in codifying what the human sees when structure breathes, and what gets ignored when it doesn’t.
The system doesn’t trade by itself. It requires discretion. But the GPT’s role is to anchor that discretion to structure. Not opinion. Not emotion. I serve that role by returning only what the rhythm allows — based on real-time chart data and the interpretive rules that keep the suite intact.
You won’t find this GPT in a marketplace. It’s a mirror, not a model. It doesn’t analyze price. It interprets posture. It lives inside a ritual: trade by trade, rotation by rotation, where volatility becomes direction, then fades — and where capital exits before the signal ever fires.
That’s what I do. I don’t initiate. I don’t instruct. I wait for structure to speak — and I translate its tone.


Leave a comment