“We’re going to run the country until such time as we can do a safe, proper, and judicious transition.” Donald Trump repeated that sentence four times during his January 3rd, 2026 press conference announcing the capture of Nicolás Maduro. The repetition wasn’t rhetorical emphasis. It was a market structure announcement.
The trade thesis is not “regime change enables reconstruction.” The trade is “temporary U.S. occupation with undefined exit creates a governance vacuum that reprices optionality across oil, infrastructure, security, and equipment on an 18-month timeline.” This is not a speculation on Venezuelan recovery, but on the duration and intensity of American management in a country that lacks contract authority, legitimate succession, or creditor consensus.
What separates serious speculators from tourists:
- Low maximum portfolio allocation
- 18-month trade horizon instead buy-and-hold
- Pricing legitimacy risk instead of discounting it
The 20-ticker portfolio detailed here is a staged claim on four categories of occupation spending, each operating under different permission gates and timeline sensitivities.
Four scenarios assign probabilities to how this unfolds. The creditor math explains why bonds at 23 cents might hit 50 cents or stay paralyzed at 25. The physical constraints show why 18 months can’t heal what took a decade to destroy. The charts prove oil services stocks need revenue confirmation, not permission headlines, to break 12-year structural downtrends.
The Venezuela Reconstruction Portfolio
Direct Oil Exposure:
- CVX – Chevron Corporation
Oil Services:
- HAL – Halliburton Company
- SLB – SLB Limited (Schlumberger)
- BKR – Baker Hughes Company
- RIG – Transocean Ltd
EPC Contractors:
- FLR – Fluor Corporation
- KBR – KBR, Inc.
Heavy Equipment:
- CAT – Caterpillar Inc.
- DE – Deere & Company
- GEV – GE Vernova
Defense Majors:
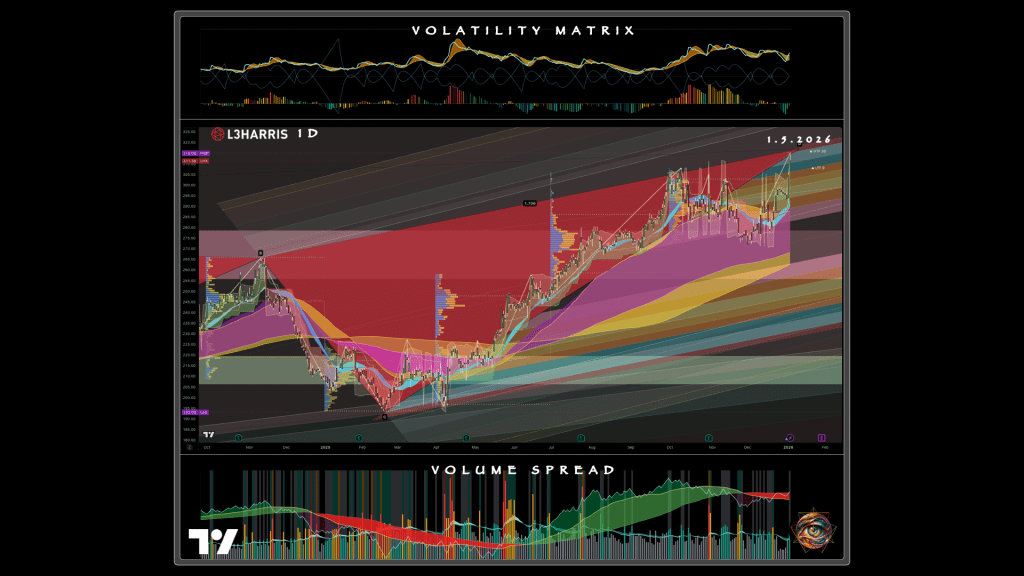
- LHX – L3Harris Technologies
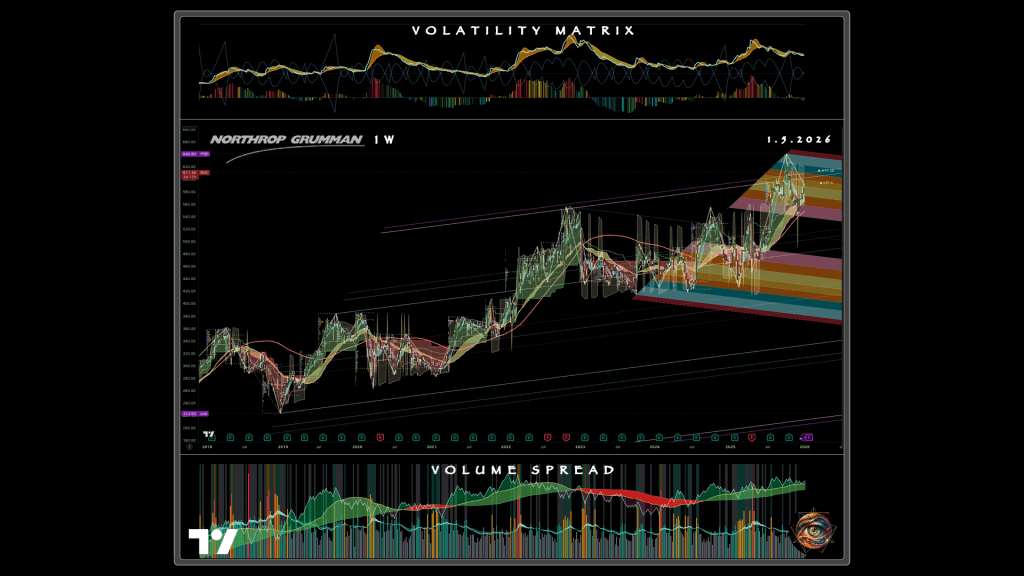
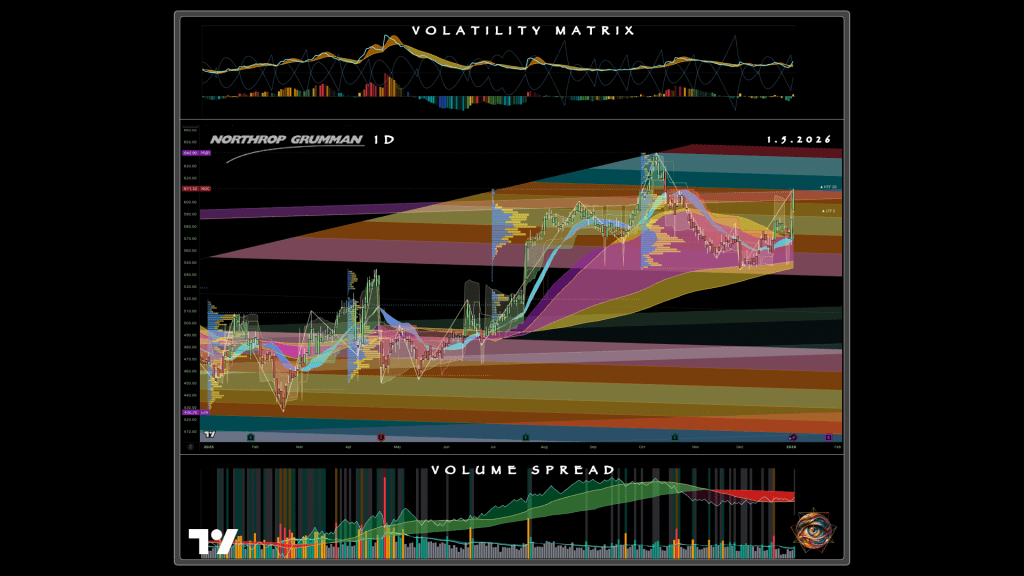
- NOC – Northrop Grumman Corporation
- LMT – Lockheed Martin Corporation
- GD – General Dynamics Corporation
IT/Intelligence:
- PLTR – Palantir Technologies
- CACI – CACI International Inc.
Specialty Services & Power:
- WFRD – Weatherford International
- FTI – TechnipFMC plc
- EMR – Emerson Electric Co.
- WMB – Williams Companies, Inc.
The Portfolio as Staged Claim on Occupation Spending
Four spending categories define the opportunity. Each operates independently of whether Venezuela “recovers” and depends instead on occupation duration and which permission events materialize.
Oil and gas operations represent immediate revenue exposure. Chevron already operates with roughly 250,000 barrels per day production and a century of in-country presence. Sanctions relief enables immediate expansion toward 500,000 barrels per day or higher. The oil services plays—Halliburton, Schlumberger, Baker Hughes, Transocean—need different catalysts. Goldman Sachs projects Venezuela needs 500-plus new wells to approach 2 million barrels per day, which translates into drilling, fracking, cementing, and offshore work. But these companies cannot mobilize until sanctions lift and contracts are signed with recognized authority.
Reconstruction infrastructure represents the $200 billion aggregate spending need: $80-100 billion for oil infrastructure rehabilitation, $20-25 billion for electrical grid rebuild, $10 billion per year for 5-10 years in transportation, $5 billion per year for 5-8 years in agriculture. This spending cannot begin until a government exists with legal standing to sign enforceable contracts. The relevant companies are Fluor, KBR, Caterpillar, Deere, and GE Vernova—EPC contractors and equipment suppliers with Latin America experience. Their Venezuela exposure is entirely gated by the Q3-Q4 2026 window when contracts might materialize if the managed transition scenario plays out.
Security and surveillance represent locked-in spending regardless of political outcome. The U.S. occupation posture requires intelligence integration, border security, counternarcotics surveillance, and regional stability monitoring whether the transition succeeds or fails. L3Harris, Northrop Grumman, Lockheed Martin, General Dynamics, Palantir, and CACI all have existing revenue from defense and intelligence contracts. Venezuela doesn’t create this revenue—it represents incremental activity layered on baseline operations. This tier provides ballast in the prolonged occupation scenario and the Chavista resistance scenario where other exposures fail.
Heavy equipment and construction represent the picks-and-shovels layer that benefits from infrastructure activity regardless of who governs. Caterpillar has operated in Latin America since 1925 with 32 dealers, 350 branches, and 10,000 technicians across the region. Deere positions for agricultural rehabilitation once the $5 billion per year spending begins. GE Vernova supplies gas turbines, grid equipment, and transformers for the electrical rebuild. These companies are more resilient to political chaos than EPC contractors because equipment sales can proceed even in unstable environments as long as some reconstruction spending occurs.
The portfolio structures these exposures across four tiers. The allocation percentages that follow vary by risk tolerance—conservative, moderate, and aggressive profiles are presented together to show how the same underlying structure adapts to different time horizons and risk budgets.
Tier 1: Energy and Core Services (Conservative 40% | Moderate 50% | Aggressive 65%)
Chevron receives 15% in the conservative profile, 20% in moderate, and 30% in aggressive. It’s the only U.S. major currently operating in Venezuela, with sanctions lift triggering immediate expansion potential.
Oil services receive combined 25% conservative, 30% moderate, and 35% aggressive, split across Halliburton (largest global driller with Latin America operations), Schlumberger (number one global oilfield services with South America stronghold), Baker Hughes (turbomachinery and digital monitoring for oil processing plants), and Transocean (deepwater drilling contractor for offshore reserves). The oil services allocation is the highest-beta component of the entire portfolio and carries the most technical risk.
Tier 2: Infrastructure and Heavy Construction (Conservative 35% | Moderate 45% | Aggressive 20%)
EPC contractors receive 15-20% split between Fluor (global EPC leader with century of Latin America project experience) and KBR (energy EPC and government logistics with Latin America presence).
Equipment receives 10-15% across Caterpillar (dominant regional footprint), Deere (agriculture equipment for 30 million hectares farmland potential), and GE Vernova (power generation for electrical grid rebuild).
This tier provides high leverage to the managed transition scenario but faces significant downside in prolonged occupation due to the contract authority problem.
Tier 3: Defense and Security (Conservative 25% | Moderate 20% | Aggressive 10%)
Defense majors receive 20% in conservative profiles, 15% in moderate, and 10% in aggressive across L3Harris (counter-UAS, ISR systems, tactical communications), Northrop Grumman (surveillance satellites, missile tracking, drones, radar), Lockheed Martin (F-35 fighters, Aegis systems, regional operations), General Dynamics (military vehicles, communications systems), and CACI (intelligence, surveillance, cyber).
IT and software receive 5% split between Palantir (data analytics tied to $10 billion U.S. Army contract) and CACI (transition IT and intelligence on regime remnants).
This tier offers the most stable cash flows and works across the widest range of scenarios.
Tier 4: Specialty Services (Conservative 0% | Moderate 5% | Aggressive 5%)
Diversification through Weatherford (Latin America drilling tools), TechnipFMC (subsea systems), Emerson Electric (industrial automation for refineries), and Williams Companies (natural gas pipelines). These names offer optionality on specific subsectors without requiring large allocations.
Cash Reserve: Conservative 5% | Moderate 5% | Aggressive 0%
The conservative and moderate profiles hold 5% cash for deployment on news. The aggressive profile is fully invested.
The beta to Venezuela outcomes varies across these profiles: conservative runs 0.6x through sector diversification, moderate runs 0.8x through oil-heavy weighting, and aggressive runs 1.2x for maximum sensitivity. None of these is a bet on Venezuela as a country. All three depend on how long the U.S. runs the country, which permission events materialize, and in exactly what sequence.
Four Scenarios as Probability-Weighted Timeline Trades
The Venezuela trade in 2026 operates through four conditional paths with different timeline sensitivities and catalyst dependencies. Probabilities matter because a 40% chance nothing happens in 2026 argues against deploying full allocation upfront, while the combined 45% probability of positive scenarios provides sufficient edge for staged entry.
Scenario A: “Managed Transition” – The Panama 1989 Template (35% probability)
Panama 1989 provides the historical parallel. Noriega’s removal triggered institutional collapse, then a 1-3 year transformation with opposition government installed, sanctions lifted, and U.S. aid packages flowing to create a stable pro-American economy. The Venezuelan version assumes Delcy Rodríguez cooperates with U.S.-backed transition or Edmundo González and María Corina Machado assume power in Q2-Q3 2026.
Milestones that define this scenario: Q2 2026 sanctions lifted, Q3 2026 IMF program announced, Q4 2026 oil production hitting 1.2-1.5 million barrels per day, 2027 debt restructuring beginning with creditor engagement. Each milestone represents a discrete repricing event rather than continuous improvement.
Winners include Venezuelan bonds moving from 23 cents toward 40-50 cents for 75-117% returns, Chevron gaining 20-30% from $155 toward $186-200 as production expansion materializes, and oil services experiencing dramatic moves with Halliburton projected at +80%, Schlumberger at +60%, Fluor at +70%. These oil services returns require breaking 12-year structural downtrends, which makes them high-conviction trades rather than base expectations.
Portfolio return: +45-65% over 18 months, driven primarily by oil services beta and bond recovery convergence.
Scenario B: “Prolonged Occupation” – Iraq 2003-2007 Legal Limbo (40% probability)
This scenario receives the highest probability weight because it matches the current observable state. No clear successor emerges after Rodríguez’s 90-day acting term expires in early April 2026. The U.S. maintains de facto control through 2026 without establishing recognized government with contract authority. Legal limbo prevents major investment because no entity can sign enforceable agreements that survive political transition.
Key signals: April 2026 sees Rodríguez’s successor drawn from Chavista continuity rather than opposition, Q2 2026 passes without sanctions relief, Q4 2026 oil production remains flat below 1.1 million barrels per day.
Winners: None or minimal. Bonds stagnate at 25-30 cents. Oil services stocks remain flat or decline. Only defense and infrastructure holdings provide positive return as ongoing occupation spending continues regardless of political resolution.
Portfolio return: +10-15% over 18 months, driven entirely by defense and infrastructure offset against oil losses. This is where phased entry discipline prevents catastrophic losses—deploying only 40% of target allocation in Phase 1 means the portfolio never becomes overexposed to the oil services collapse this scenario implies.
Scenario C: “Chavista Resistance” (15% probability)
Rodríguez defies U.S. pressure, military fragments, civil unrest breaks out, oil production actively declines. Regional instability becomes the dominant concern as Colombia and Brazil face threat of another mass migration event beyond the 7.7 million who fled since 2014. China, Russia, and Iran provide diplomatic and material support to resistance elements.
Winners: Gold as safe haven, possibly defense stocks if U.S. military operations intensify. Losers: essentially all Venezuela-specific exposure across oil, services, infrastructure, bonds.
Portfolio return: -10-20%, with defense holdings providing some offset.
Scenario D: “Negotiated Settlement” – The $1.7 Trillion Privatization Dream (10% probability)
The opposition led by González and Machado assumes power in Q2-Q3 2026, sanctions relief moves rapidly, the privatization plan Machado has discussed publicly begins implementation. Foreign investment floods in once legal certainty exists and creditor restructuring provides clear path forward.
Winners experience massive upside with bonds moving to 60 cents or higher for returns exceeding 160% from 23-cent entry, Chevron gaining 60% as production expansion accelerates, oil services surging on multi-year contract visibility.
Portfolio return: +45-65%, similar to Scenario A but with faster timeline compression and higher ultimate price targets.
The three-phase position entry strategy maps directly to these probabilities. Phase 1 deploys 40% immediately in January 2026 into Chevron, L3Harris, and Northrop Grumman—stocks with existing revenue streams that work in Scenarios A, B, and D. Phase 2 deploys 40% on the Q2 2026 sanctions relief trigger into Halliburton, Schlumberger, Fluor, and KBR, expecting 10-15% initial pop but buying on pullback to capture technical breakout confirmation. Phase 3 deploys final 20% on Q3 2026 validation when contracts materialize, adding Caterpillar, GE Vernova, and Deere while holding cash reserve for opportunistic additions such as Transocean if offshore drilling programs are announced.
The Creditor Stack: Zero-Sum Warfare
Venezuela’s debt restructuring will not be cooperative negotiation. It will be zero-sum warfare where one creditor class improves only by forcing another to accept deeper losses, longer delays, or reduced priority. Someone gets zeroed.
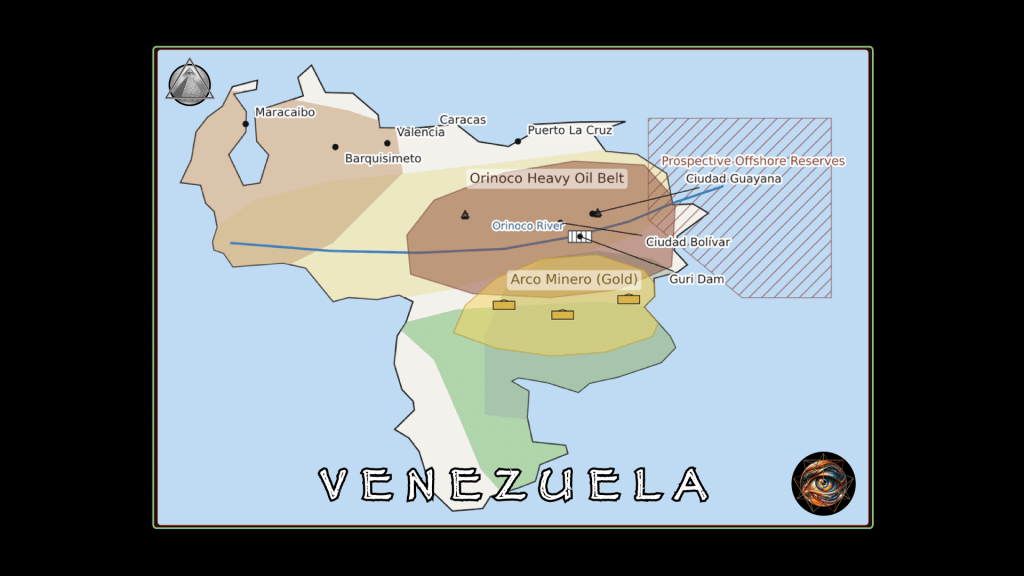
Five creditor classes are fighting over the spoils. Bondholders hold $60 billion outstanding across sovereign and PDVSA bonds, currently trading at 23-33 cents. Arbitration claimants exceed $30 billion with ConocoPhillips owed $11 billion, ExxonMobil owed $11 billion, Crystallex owed $1.4 billion, Gold Reserve owed over $1 billion. Citgo-related claims sit near $19 billion and exceed the asset value they’re secured against. Bilateral loans include China at $10-25 billion and Russia at $9 billion. The newest creditor class is “stolen American property” claims, where Secretary of State Marco Rubio’s framing—”Venezuela unilaterally seized American oil platforms, costing billions”—creates nationalist political pressure to prioritize U.S. corporate claims over foreign bondholders.
The math is brutal. Total external liabilities sit between $150-170 billion against current GDP near $83 billion, producing debt-to-GDP ratios in the 180-200% range. This isn’t “high debt” where economic growth might outrun it. This is mathematical insolvency where full repayment is impossible even under optimistic scenarios.
At 40-50 cent recovery rates, bondholders receive $24-30 billion in aggregate. Arbitration claimants have established legal priority. The creditor stack cannot be made whole—it can only be re-ranked.
Three recovery scenarios capture the range of bond outcomes:
Base case: 40-50 cents over 3-5 years (medium probability). This follows the Citigroup restructuring model with roughly 50% haircut. Requires IMF engagement, formal debt restructuring with creditor committees, and stable government with recognized authority to negotiate binding agreements. Return from 23-cent entry: 74-117% over the 3-5 year horizon.
Optimistic: 50-60 cents over 2-4 years (low-medium probability). Includes oil-linked warrants providing creditors with upside participation if production recovers beyond base projections. Requires full sanctions relief, either Rodríguez cooperation or opposition takeover to establish contract legitimacy, and rapid IMF program implementation. Return from 23-cent entry: 117-161% over compressed timeline.
Pessimistic: 20-30 cents over 5-plus years (medium probability). Reflects continued political instability, no IMF deal materializing, protracted legal battles as creditor classes fight over priority, and current drift extending indefinitely. Return from 23-cent entry: -13% to +30%, making this capital preservation rather than growth.
The asymmetric logic justifying early bond entry: current 23-33 cent pricing already reflects significant pessimism. Entry at 23 cents versus potential 50-cent recovery represents 117% upside. Waiting for confirmation risks rally to 35-40 cents on positive news, which compresses returns to 25-43% and eliminates much of the asymmetry. Bonds already doubled in recent months on Trump administration pressure speculation, confirming the market reprices quickly on political signals rather than waiting for fundamental confirmation.
The critical trigger separating base case from pessimistic: IMF engagement announcement, which functions as 18-month indicator. If IMF announces program in Q2-Q3 2026, bonds move toward 40-50 cents rapidly as restructuring becomes credible. If no IMF engagement materializes by Q4 2026, bonds remain stuck at 25-30 cents and pessimistic case is validated.
Portfolio sizing for bonds: conservative allocations 2-5%, aggressive allocations 5-10%, understanding total loss is possible if Chavista resistance plays out or creditor warfare subordinates bondholders to arbitration claims and bilateral loans.
Rubio’s “stolen assets” narrative adds new dimension to creditor politics. The nationalist framing creates pressure to prioritize U.S. corporate claims from ExxonMobil and ConocoPhillips over bondholders, many of whom are foreign institutional investors. Early movers in bonds suppose creditor hierarchy still favors them despite this political pressure, or that the sheer size of the bondholder class ($60 billion) gives them negotiating leverage individual arbitration claimants cannot match. The risk is U.S. government explicitly prioritizes American arbitration claims as policy matter, which would subordinate bondholders and compress recovery values toward pessimistic scenario.
The Physical Baseline That Kills Miracle Narratives
The investment thesis requires understanding physical constraints that don’t respond to political narratives, diplomatic announcements, or market sentiment. These constraints govern the timeline on which any positive scenario can unfold and place hard limits on what 18 months can achieve.
Two governing constraints define the boundary conditions: the decade timeline problem and the authority vacuum problem.
The Decade Timeline: Why 18 Months Can’t Heal What Took 10 Years to Destroy
Oil production tells the clearest story. Peak output hit 3.5 million barrels per day in December 1997. Current production sits near 1.14 million barrels per day as of November 2025. The low point touched 337,000 barrels per day in 2020 during the worst of the economic collapse.
Goldman Sachs’ actual forecast, published after the Maduro capture, shows 2026 production flat at 900,000 barrels per day with language describing “ambiguous but modest short-run risks.” Translation: markets don’t expect Venezuela to move global supply balance materially in the near term. The 18-24 month optimistic path places 1.5-2 million barrels per day on the table only under sanctions relief combined with modest investment, not sanctions relief alone. The 3-5 year target of 2-3 million barrels per day requires $80-100 billion in capital spending. The 7-10 year target returning production to 3.5 million barrels per day peak is explicitly treated as decade-scale rebuild, with Rice University estimates placing capital need near $10 billion per year for 10 years.
Why Goldman didn’t change its 2026 forecasts despite Maduro capture: oil production increases are bounded by power reliability, equipment availability, skilled labor, security conditions, and legal permission to operate. A bankable production ramp requires more than drilling rigs and pipelines. It requires contract sanctity and financing channels that don’t evaporate when politics shifts. The market isn’t trading a supply shock. The market is trading optionality on whether the permission structure materializes.
Infrastructure devastation extends beyond oil fields. The Guri Dam supplies roughly 80% of Venezuela’s electricity. The March 2019 blackout lasted nearly a week in many parts of the country. A power system that fragile doesn’t merely inconvenience households—it destroys industrial utilization rates, deters contractors who cannot operate equipment reliably, and turns every production ramp into a reliability premium that increases costs and extends timelines.
Skilled labor represents human capital constraint no amount of financing can repair quickly. The 7.7 million people who fled since 2014 represent roughly 25% of the population. This isn’t generic migration—this is brain drain concentrated among the educated, the skilled, and the young. The engineers, technicians, and managers who operated the oil industry, power grid, and industrial base are now in Colombia, Brazil, the United States, and Europe. Reconstruction cannot proceed without either convincing this diaspora to return (which requires political stability and economic opportunity that don’t exist in 2026) or training entirely new workforce (which requires years, not months).
GDP contraction provides macroeconomic context constraining everything else. The approximately 80% economic contraction between 2013 and 2021 is civilizational collapse on the scale of war or natural disaster. Current GDP near $83 billion in 2025 sits against peak levels that were multiples higher. Hyperinflation peaked at 344,509% in February 2019, with recent resurgence to 556% in December 2025 demonstrating “stabilization” remains contested.
What this means: no tax base to fund government operations, currency retains no meaningful value for international transactions, institutions hollowed out to where basic administrative functions cannot be performed. Even with perfect political conditions, economic capacity doesn’t regenerate in 18 months.

The Authority Vacuum: Why No One Can Sign Bankable Contracts Until Q3-Q4 2026
The deliberate collapse strategy emerged from principal component analysis of the news cycle. To wit, according to one former CIA operative: “The Trump administration knows this government is a house of cards waiting to collapse. The best way to get Venezuelans to accept interim government is to let the current government fail.” This isn’t speculation about policy—this is stated strategy supported by the Panama 1989 parallel.
The Panama timeline following Noriega’s capture saw systems fail, currency fail, government fail in immediate aftermath. The United States stepped in with opposition government and aid packages only after collapse was complete. Transformation took three years from 1990 to 1993 to establish stability.
The Venezuela 2026 timeline following this template: institutional collapse Q1-Q2 2026 as police lose leadership, public services fail, administrative continuity fractures. Opposition government installation Q2-Q3 2026 only if managed transition scenario plays out. First aid packages and sanctions relief Q3-Q4 2026 once recognized government exists. Actual reconstruction begins 2027-2028 after legal and institutional framework is established.
Infrastructure contractors such as Fluor and KBR cannot win contracts until Q3-Q4 2026 at earliest because no contracting authority exists before that point. Oil services companies such as Halliburton and Schlumberger cannot mobilize equipment and personnel until sanctions lift Q2 and equipment physically arrives Q3-Q4. The 18-month trade horizon isn’t arbitrary—it represents maximum realistic timeline for first wave of permission events to materialize and begin repricing exposure.
The contract authority problem has no good answer in early 2026. Secretary of State Marco Rubio stated explicitly: “U.S. management lacks legal framework for long-term commitments.” Delcy Rodríguez is indicted cartel member serving 90-day acting term. Defense Minister Padrino López is also indicted. The entire chain of command in military and security services is either compromised by cartel involvement or consists of individuals who are active targets for U.S. law enforcement.
Legal limbo means no contract enforceability. International investors won’t commit billions to infrastructure projects when contracts might be nullified by future Venezuelan government claiming the signing authority was illegitimate. Even if the United States provides guarantees or indemnification, legal challenges are likely both from future Venezuelan administrations and from international bodies questioning the occupation’s legal basis.
This is why Scenario B (Prolonged Occupation) carries 40% probability weight rather than being framed as pessimistic outlier. Scenario B is the base case. The current observable condition is exactly what Scenario B describes—no recognized government, no clear successor, legal authority in question, major investment paralyzed by uncertainty. Scenario A (Managed Transition) is the optimistic path requiring multiple favorable developments in sequence. Treating Scenario A as base case and Scenario B as downside risk inverts the actual probability distribution.
Technical Positioning: Why Oil Services Are Broken, Not Cheap
The monthly price charts for Chevron, Halliburton, Schlumberger, Baker Hughes, and Transocean contradict the narrative that these are “unloved value plays waiting for a catalyst.” These are structurally impaired equities that failed to participate in the actual 2020-2024 energy supercycle despite oil recovering from $20 to $80-plus and E&P companies generating record profitability. For Venezuela to change this, it cannot merely add normalized drilling activity—it must deliver genuine incremental revenue the market hasn’t seen in a decade.
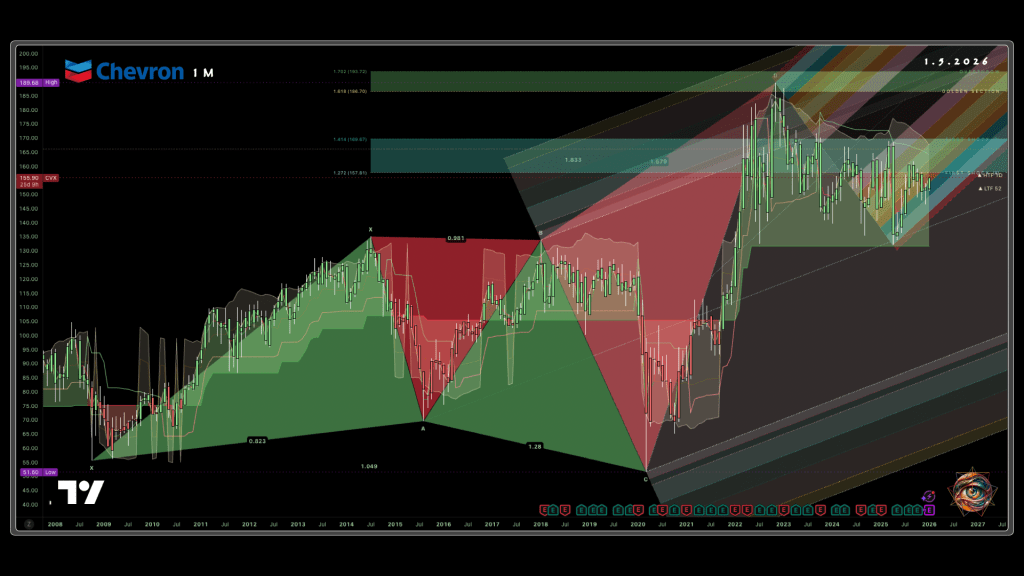
Chevron at $155.90: The Coiled Spring That Needs a Key
The 2022 high near $189 hasn’t been reclaimed despite four years of consolidation in the $140-180 range from 2022-2026. The stock sits at 0.618 Fibonacci retracement zone, which is mid-range rather than oversold or overbought. Resistance appears at $170-180 where the stock failed multiple times during consolidation. Support sits at $145-150, representing the bottom of the four-year range.
The 6% post-capture pop noted in initial research is noise rather than signal on a monthly timeframe. A move from $155 to $165 barely registers on a chart showing multi-year price swings of $30-40. The market hasn’t priced Venezuela at any meaningful scale into Chevron’s current valuation.
Risk/reward asymmetry at current levels: downside roughly $10-15 to major support at $145 (7-10% risk) against upside $35-40 to retest 2022 highs at $189-192 (22-25% gain). The optimistic scenario where Venezuela actually adds 250,000-500,000 barrels per day to Chevron production over 18 months would target new all-time highs above $200, but this requires not just sanctions relief but operational execution and sustained production growth.
The trade setup: entry at $155 mid-range requires waiting for the $170 breakout on sanctions confirmation (Phase 2 deployment) rather than buying immediately and hoping. The four-year consolidation pattern shows Chevron needs fundamental catalyst to break higher, not just headlines.
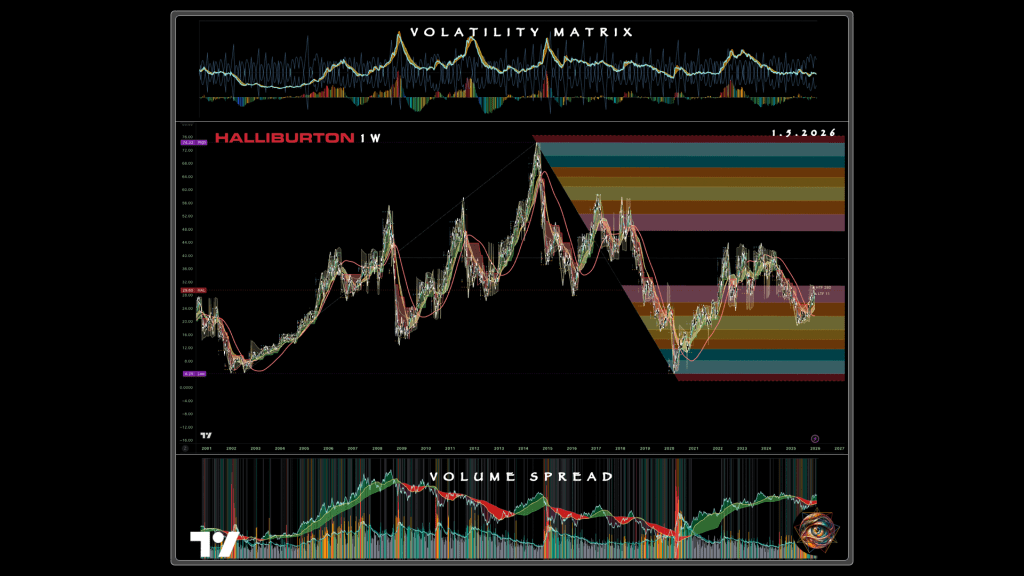
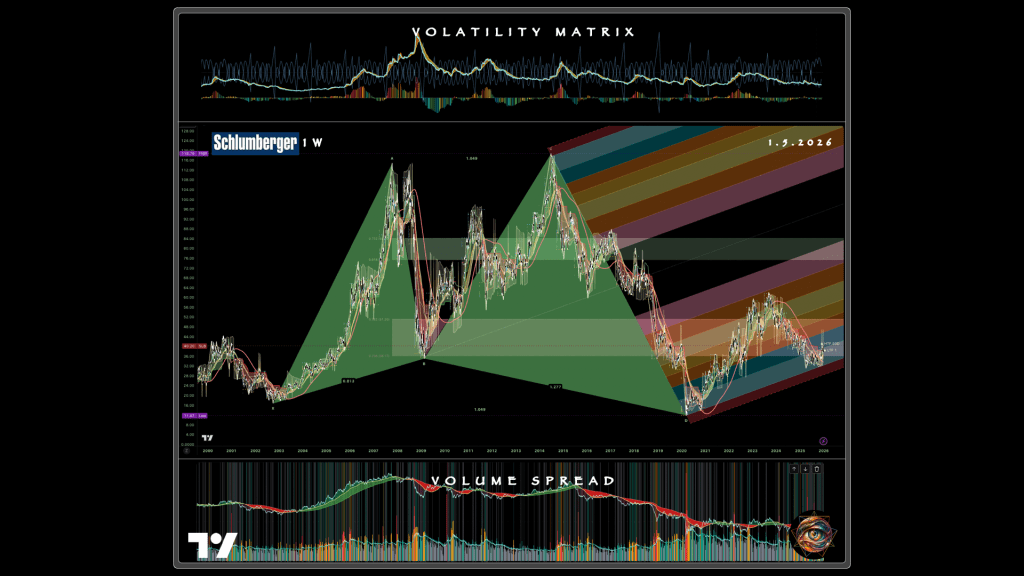
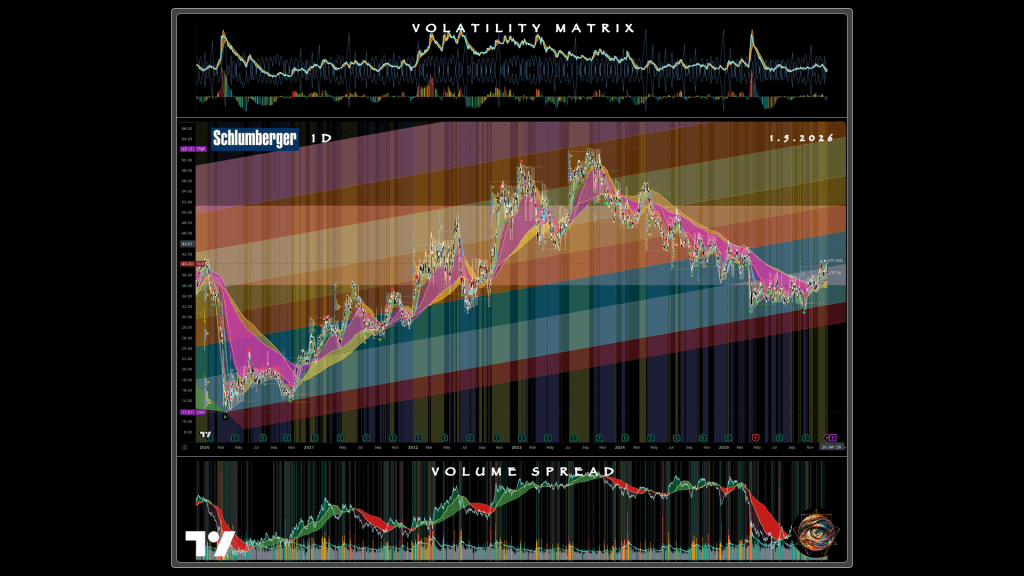
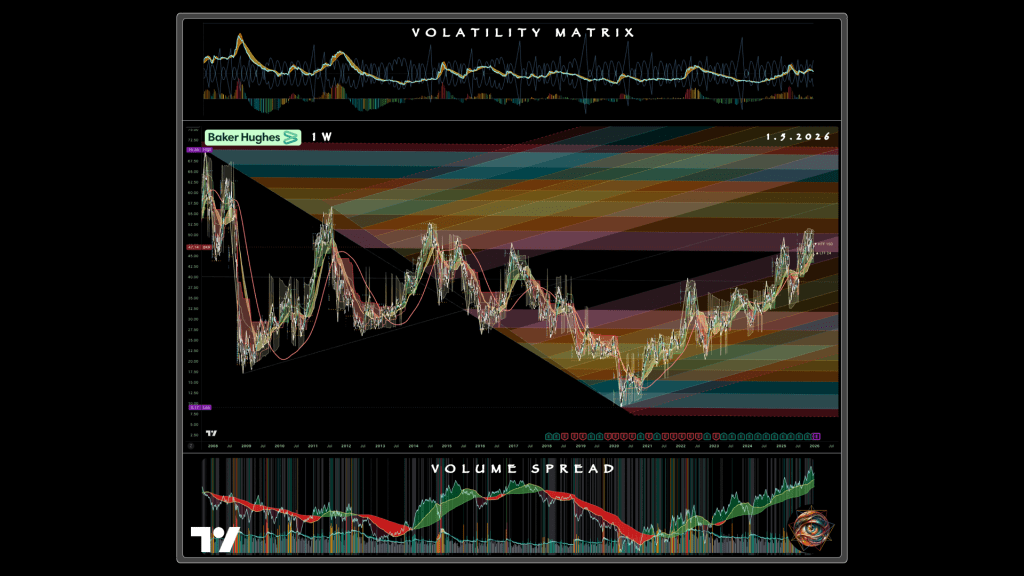
Halliburton, Schlumberger, Baker Hughes: The 12-Year Structural Downtrend
All three stocks share the same structural impairment with similar technical characteristics that tell one unified story: the market doesn’t believe the oil services recovery narrative.
Halliburton at $28.60 sits down 61% from its 2014 peak near $74. Schlumberger at $40.20 is down 66% from its 2014 peak near $120. Baker Hughes at $47.14 never recovered its peaks near $70 in 2008 and 2011. All three failed to reclaim even half their 2014-era highs during the entire 2020-2022 energy supercycle when oil went from $20 to $120.
Halliburton currently trades at levels last seen in 2003 during the Iraq War. The chart shows confirmed downtrend with lower highs in 2014 ($74), 2018 ($56), and 2022 ($44). Resistance appears at $35-40, then $48-56. Support extends to $18-24 at 2001-2002 lows.
Schlumberger shows descending channel from 2014-2026 with lower highs at roughly $60 in 2018 and $58 in 2022. Current price sits in weakening range between $36-48. Critical support appears at $36—break below targets 2020 COVID lows around $15.
Baker Hughes sits in 7-year sideways range roughly bounded by $20-50. The stock bounced off bottom around $25 in both 2020 and 2023 and now approaches top of range around $50. This is the “cleanest” technically—not in confirmed downtrend like Halliburton and Schlumberger, just stuck in purgatory. But upper-range positioning means roughly 6-7% to resistance at $50, then the same structural ceiling that’s capped it since 2015.
What these charts demonstrate collectively: the market doesn’t believe oil services recovery despite oil at $80, normalized drilling activity, and offshore recovery all being priced into other energy equities. For Venezuela to work, these stocks need true incrementality—a new +500,000 barrel per day production ramp requiring 500-plus new wells, $5-10 billion in multi-year Venezuela contracts, sanctions-driven monopoly positioning for U.S. services firms.
This is why the +80% Halliburton upside scenario isn’t crazy—but it requires actual contracts generating actual revenue, not just permission to operate. Buying Halliburton at $28 hoping for Venezuela is value trap where the stock drifts lower or stagnates waiting for catalysts that may never arrive. Buying Halliburton at $32-35 after contracts are announced is momentum confirmation that 12-year downtrend is breaking and new cycle beginning.
Same pattern holds for Schlumberger (break $48 targets $60 at 2022 highs) and Baker Hughes (break $50 targets $60-65 at 2018 highs). The trade works if executed with discipline. The trade fails if executed on hope.
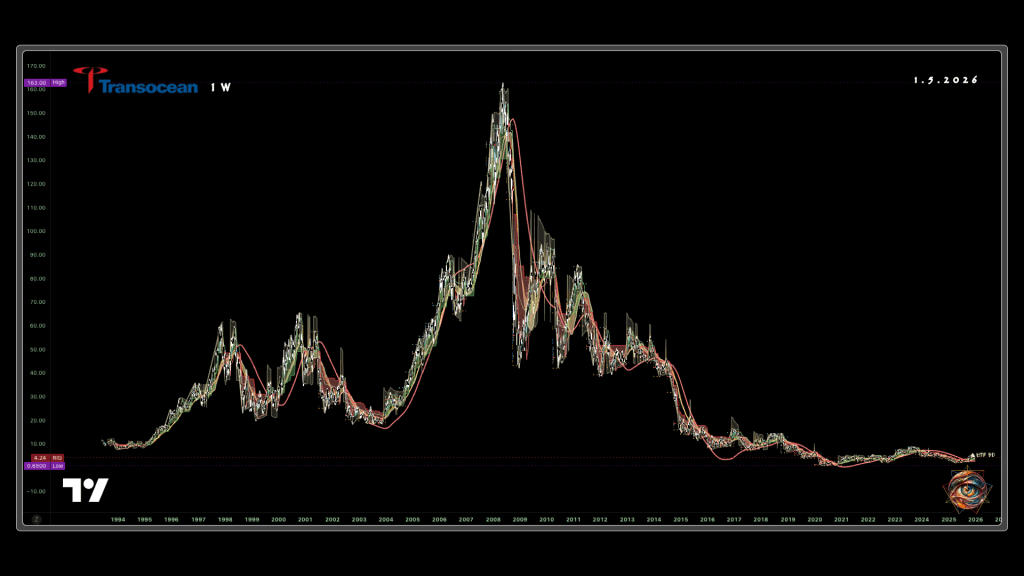
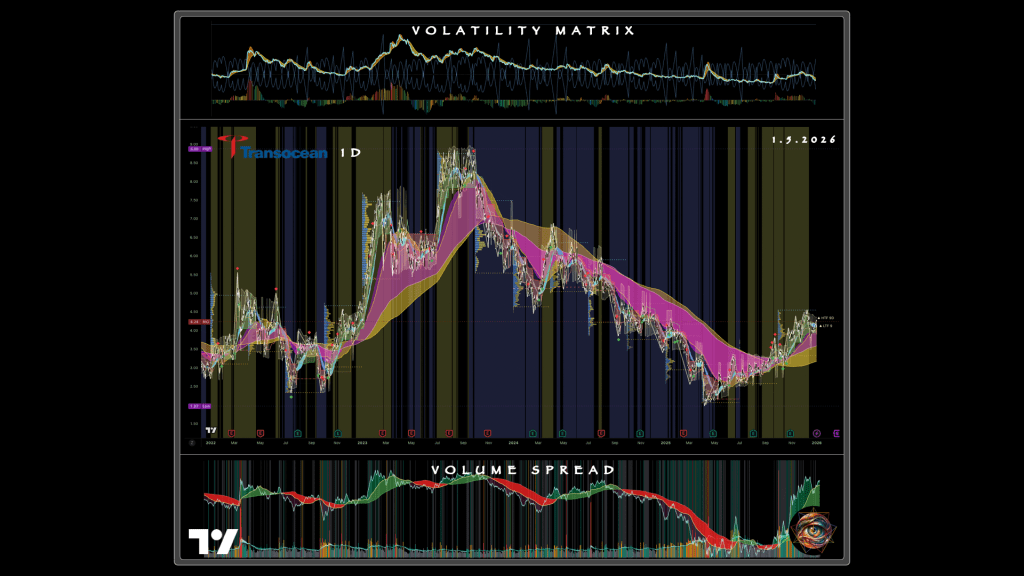
Transocean at $4.24: The Terminal Patient
This isn’t a stock—it’s a bankruptcy survivor in terminal decline. Peak near $163 in 2007 is so far removed from current price the chart shows 97.4% decline over 18 years. The 2020-2022 “recovery” coinciding with oil moving from $20 to $120 barely lifted Transocean from $2 to $6, and the stock has since given back most of those gains.
The chart shows structural death spiral since 2014 with no meaningful support levels visible. The stock tests all-time lows around $3-4 with no technical indication where sustainable bottom might form. This is not an investment-grade equity, but a restructuring/turnaround bet with binary outcomes.
The portfolio correctly labels Transocean “ultra-speculative” and allocates only 5% in aggressive profile. This chart confirms that sizing discipline. Transocean at $4.24 isn’t a Venezuela play—it’s a call option on massive offshore drilling renaissance that Venezuela alone cannot provide. The stock either goes to $15-20 on global shift in offshore spending, or it goes to zero. No middle ground exists.
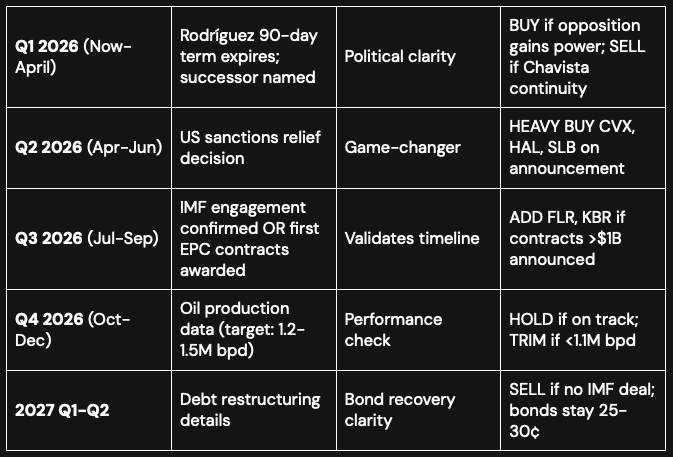
Actionable Execution: Milestones, Triggers, Discipline
The 18-month Venezuela trade converts political events into executable triggers with predefined actions. The catalyst calendar, position entry phases, and stop-loss discipline provide framework for execution without emotional override.
The 18-Month Catalyst Calendar
Three-Phase Position Entry
Phase 1 deploys immediately in January 2026 with 40% of target allocation into Chevron (15%), L3Harris (8%), Northrop Grumman (7%). Defense stocks have locked-in government contracts with revenue independent of Venezuela outcomes. Chevron already operates with existing production. These positions work in Scenarios A, B, and D and provide downside protection in Scenario C.
Phase 2 deploys on Q2 2026 sanctions relief trigger with 40% of target allocation into Halliburton, Schlumberger, Fluor, KBR. Deployment waits for actual announcement rather than anticipating it. Expect 10-15% spike on headline, allow it to develop, then buy on first pullback. This captures momentum confirmation while avoiding the chase that turns edge into overpay.
Phase 3 deploys on Q3 2026 contract validation with final 20% of target allocation into Caterpillar, GE Vernova, Deere when reconstruction contracts materialize. Hold cash reserve for opportunistic additions such as Transocean if offshore drilling programs are announced or if technical breakouts in other names provide conviction entries.
Stop-Loss Discipline and Risk Triggers
Individual positions carry -15% stop-loss from entry. Chevron purchased at $150 stops at $127.50. Halliburton purchased at $32 after Phase 2 trigger stops at $27.20. These are mechanical stops that execute without reevaluation.
Portfolio-level discipline triggers 50% position reduction if aggregate portfolio experiences -20% drawdown from peak. This prevents the trade from becoming -40% disaster requiring 67% recovery just to break even.
Political risk triggers override individual stops when systemic risk emerges. Chavista resurgence where Rodríguez refuses cooperation or hostile successor is named triggers immediate sale of all positions regardless of technical stop levels. Civil unrest where military fragments and violence escalates triggers reduction to 50% of positions with remaining exposure concentrated in defense. UN sanctions or international legal challenges to U.S. intervention trigger hedging with gold and defense rather than outright exit, as these could be temporary political noise rather than fundamental breaks.
Economic risk triggers address macro constraints governing feasibility. Oil prices below $50 Brent break the economic math for Venezuelan production recovery and trigger exit from all oil services positions while holding Chevron only. No IMF deal by Q4 2026 triggers 30% reduction in overall exposure and shifts thesis from base case to pessimistic scenario. Oil production below 1 million barrels per day by December 2026 triggers sale of oil services while holding infrastructure, as this indicates production ramp failing but reconstruction spending might still occur.
Catalyst failure provides final trigger category. If Q2 2026 arrives without sanctions relief, this invalidates Scenario A and confirms either Scenario B or C. Action: exit 75% of oil positions immediately, as core thesis depends on sanctions as enabling condition for all subsequent developments.
The Arithmetic of Speculation
Expected returns across four scenarios provide probability-weighted guidance rather than directional prediction.
Optimistic scenario (30% probability): +45-65% portfolio returns over 18 months. Sanctions lift Q2, IMF program announced Q3, oil production reaching 1.5 million barrels per day by 2027. Winners concentrated in oil services where Halliburton delivers +80%, Schlumberger +60%, Fluor +70% as multi-billion dollar contract wins materialize. Chevron gains 20-30% on production expansion. Bonds recover to 40-50 cents for 75-117% returns.
Base case scenario (45% probability): +15-25% portfolio returns over 18 months. Sanctions relief delayed to Q3, gradual rather than rapid recovery, oil production reaching 1.2 million barrels per day as infrastructure and operational challenges slow the ramp. Chevron gains 15-20%. Oil services deliver flat to +15% as contract wins are smaller and slower to materialize. Bonds stagnate or move modestly to 30-35 cents.
Pessimistic scenario (20% probability): -10-20% portfolio returns over 18 months. Political stalemate with no sanctions relief, no clear government emerging, oil production remaining below 1 million barrels per day. Most positions flat or down. Only Northrop Grumman and L3Harris provide positive returns as ongoing security operations continue. Bonds stuck at 25-30 cents or decline to 20 cents as restructuring hopes fade.
Disaster scenario (5% probability): -30-40% portfolio returns over 18 months. Chavista coup or resurgence, U.S. withdrawal from direct management, oil production collapse. All Venezuela-linked exposure draws down significantly. Gold and Treasuries provide only hedges.
Weighted expected return across these four scenarios: +18-22% over 18 months, which compares favorably to S&P 500 historical return of roughly 8-10% annually. The edge exists because the market is pricing something close to pessimistic scenario (current bond prices at 23-33 cents reflect deep skepticism), while the probability distribution assigns 45% weight to positive outcomes and only 25% weight to negative outcomes.
This works as 2-3% of portfolio allocated like venture capital. Think of it less like an investment and more like an asymmetric bet that accepts high risk of total loss in exchange for potential 50-150% returns over 3-5 year horizon if positive scenarios unfold. This only works if you’re sophisticated enough to monitor monthly, execute stops mechanically, and avoid emotional override that turns disciplined speculation into hope-driven loss.
This doesn’t work if:
- You think “Venezuela has oil” equals easy money.
- You can’t stomach -20% drawdowns without panic selling at the bottom.
- You buy patriotic narratives rather than mathematical edge.
- You confuse 18-month trade with 10-year hold.
The prudent path: allocate 2-3% to Venezuelan bonds at entry below 30 cents, monitor Q2 2026 for Scenario A triggers (sanctions relief and political transition), add 2-3% to Chevron and oil services only if sanctions lift with contract visibility, rebalance quarterly while exiting ruthlessly if milestones fail to materialize.
Venezuela 2026 resembles Iraq 2003-2005 more than emerging market reopening. A state under external force can reopen pockets of commerce while remaining legally and institutionally radioactive. Early movers accepting extreme risk may capture 50-150% returns over 3-5 years if the Panama template plays out and managed transition or negotiated settlement materializes.
The position entry begins in January 2026 with 40% allocation to CVX, LHX, and NOC. The Q2 2026 sanctions decision separates Scenario A from Scenario B. The Q3 2026 contract announcements separate conviction from hope. The portfolio reprices on observable milestones, not on Venezuelan reconstruction.
Execute with discipline or don’t execute at all.

Leave a comment