Tapes price stories faster than businesses can operationalize them. A stock can reprice on narrative alone, leaping from obscurity to altitude in weeks, while the underlying company still wrestles with integration timelines, regulatory approvals, and the mundane friction of making products work. Tapes can also punish stories that arrive too early, since time is the simplest solvent for crowded positioning. Enthusiasm ages poorly when proof stays perpetually around the corner. The mechanics are simple but unforgiving: marginal buyers set price, and marginal buyers care more about what happens next week than what happens next decade.
ONDAS sits inside that mismatch.
The corporate layer moves like a roll-up with a war chest and a calendar of catalysts: six acquisitions in eighteen months, a backlog that surged 180 percent in six weeks to $65.3 million, a raised revenue target of $170-180 million for 2026, and a pro-forma cash position exceeding $1.5 billion after the January 2026 offering. The market layer has already acted as if those catalysts landed. The chart has repriced from sub-two-dollar obscurity into the mid-teens, rotated through its first violent campaign, and begun digesting at altitude rather than at the lows where forgiveness comes cheap. The question now is not whether the story is real but whether the tape can hold what it already paid for.
The Story Already Landed
The business narrative is legible to anyone willing to read the press releases. A company that once operated as a niche wireless infrastructure supplier, building private LTE networks for railroads and utilities, now wants to read as a multi-domain autonomy platform: drones, counter-drone systems, ground robotics, sensors, and defense-adjacent critical infrastructure logic. The transition is framed as deliberate portfolio assembly rather than opportunistic grabbing, with acquisitions positioned as capability stitching across disparate technologies and geographies.
The portfolio itself has become substantial:
- Sentrycs (~$225M): Cyber-over-RF protocol manipulation for counter-UAS; non-jamming approach that takes control of unauthorized drones at the communication layer; integrated into Rafael’s Drone Dome system; deployed across 25-plus countries.
- Roboteam (~$80M): Combat-proven tactical ground vehicles deployed in 30-plus countries; $20M-plus in recent orders from a major military customer; expected to contribute $30M in 2026 revenue.
- Apeiro Motion (~$12M): Fiber-optic micro-spools for jamming-immune communications; addresses military demand for tethered drone systems immune to electronic warfare; customers include Israeli MOD, Rafael, and Elbit.
- Iron Drone Raider: Autonomous counter-UAS interceptor using computer vision and ballistic net capture; kinetic interdiction without GPS or RF jamming; launched from designated pods with AI target locking.
- 4M Defense (~$10M for 70% stake): Subsurface intelligence and demining robotics; AI-powered terrestrial mapping; addresses landmine and IED threats in active conflict zones.
- American Robotics: Optimus drone-in-a-box platform; first-ever FAA Type Certification for automated small UAS; enables BVLOS operations without on-site operators.
Capability stitching does not earn automatic rewards from the tape. Markets reward conversion, which is their way of asking whether a vertical campaign can harden into a regime. A vertical campaign can be rational and still be untradeable at the margin if buyers cannot defend a higher shelf through time. A regime can be irrational and still be tradeable if price holds acceptance and keeps printing higher bases. The distinction matters because ONDS has completed the campaign phase and now faces the conversion question at approximately 27 times forward 2026 EV/Sales, a multiple that requires flawless execution to justify.
Weekly charts that live in extremes teach harsh lessons. Names that spend years in dead air tend to do their real repricing in bursts, since the crowd arrives late, fights for a small float, and then discovers that liquidity cuts both ways. Daily charts that trend loudly tend to attract the wrong kind of participation, as leverage and momentum logic replace process. Weekly digestion sequences that follow loud trends tend to weaponize time, since chop can do more damage than a single sharp red candle. The geometry is visible in charts: a long base through 2022 and 2023, a violent campaign beginning in late 2024, and a current posture that looks like the first honest digestion after the move.
Altitude Demands Acceptance
Altitude changes the failure mode. Low bases can forgive noise because the market has already discounted despair. High bases cannot forgive noise because the market has already priced hope, which needs proof over time.
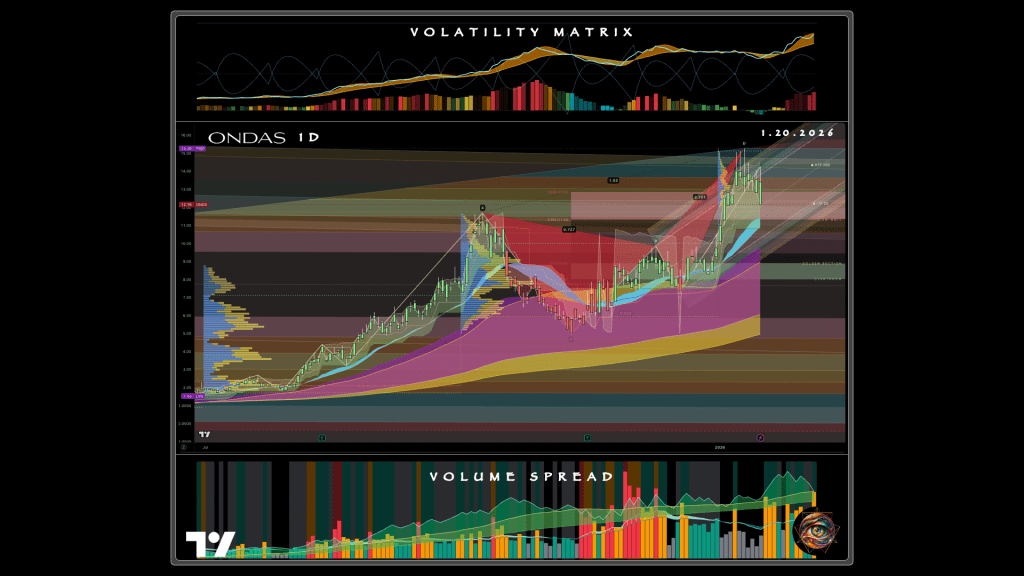
The weekly chart shows price near $12.16, digesting after a campaign that carried it from sub-two-dollar levels into the mid-teens. The volatility matrix displays elevated regime conditions, with the orange expansion band indicating that the next meaningful move is permitted to be meaningful. Volume spread confirms that the recent campaign carried real participation rather than ghost liquidity, though participation can cut both ways when the crowd discovers that buying pressure can become selling pressure with equal violence. The daily chart shows finer grain on the current structure: a surge into the mid-teens, a pullback into the low teens, and an attempt to stabilize in a range that can either become a platform or become a shelf.

The difference between a platform and a shelf is not semantic. A platform is where buyers accumulate and defend, building a foundation for the next campaign. A shelf is a slow transfer mechanism, where late buyers become inventory, early buyers become sellers, and price moves just enough to keep people engaged without rewarding conviction. A shelf can last long enough for the business case to improve and still produce a brutal experience for traders, since the tape does not owe continuation candles to anyone. The small-cap defense sector has produced both outcomes in recent years: names that converted altitude into regime, and names that bled sideways until the story aged out of relevance.
Three load-bearing zones define the current structure. The low-12s region functions as a magnet, neither bullish nor bearish, where price can spend weeks burning operators who confuse motion for edge. The range supplies enough oscillation to trigger entries and enough mean reversion to punish conviction. A magnet zone can become a floor if the cadence of closes stays constructive, or it can become a midpoint if closes migrate lower while intraday wicks create drama.
The mid-teens region functions as the first acceptance gate. The daily chart shows the market already knows this zone matters, since the prior advance culminated there and the next advance will be judged against it. A gate is not a single candle but a sequence of closes that proves the market can live above a former ceiling without needing constant adrenaline. Breakout theater, where quick spikes above resistance fail immediately and create long upper wicks, is the opposite signature and the more common outcome.
The high-teens region functions as older weekly memory, where supply becomes emotional and thick. Memory zones invite profit-taking, regret-selling, and reflex shorts, since prior participants remember pain and react before they think. The weekly chart shows this zone clearly as the ceiling from earlier price history, a level that will require time and retests to clear rather than a single momentum candle.
Volatility sets the size of consequence.
Elevated volatility does not imply direction. Rather, it implies that the next meaningful move is allowed to be meaningful. Small mistakes can become large losses quickly. Plans that depend on being right are structurally weak in such environments. Plans that depend on kill switches, non-trade zones, and time-decay rules are structurally viable.
Two Clocks Are Running
The corporate clock is visible in the company’s communications and capital markets activity. The January 2026 offering raised approximately $959 million net proceeds at $16.45 per share, a 17.5 percent premium to the prior close, signaling institutional appetite despite significant dilution. The capital structure now includes 121.58 million warrants at $28 strike with seven-year expiry, plus 17.36 million stock options and 4.99 million RSUs, creating approximately 144 million potential dilutive shares, a 36 percent overhang on the current share count. If all warrants exercise on a cash basis, Ondas could raise an additional $3.4 billion in gross proceeds, though management explicitly states no assurance can be given that any warrants will be exercised.
The war chest creates strategic optionality.
With $1.5 billion in pro-forma cash against an annual cash burn near $52 million, the theoretical runway extends nearly three decades, though that figure misleads given growth investments, integration costs, and the likelihood of continued acquisition activity. The mPrest acquisition, a $100 million bid for Iron Dome software developer valued at approximately $200 million, was frozen indefinitely by the Israeli Defense Ministry in January 2026, demonstrating that capital alone cannot guarantee execution. Discussions with Controp, a Rafael subsidiary valued at $600-700 million, reportedly continue. The Ondas Capital vehicle, established with $150 million deployment capacity, signals systematic intent to keep assembling rather than to start consolidating.
The market clock operates on different mechanics. It is not a calendar date but a cadence of closes, a willingness to accept above gates, and the time required for a campaign to progress from base to retest. The market clock can punish a company even while the corporate clock looks healthy, since the tape cares more about marginal buyers than about long-run narratives. Q3 2025 showed $18.1 million in operating expenses against $10.1 million in revenue, with gross margin improving dramatically from 3 percent to 26 percent year-over-year but operating margin remaining deeply negative at -176.1 percent. The path to profitability requires both revenue scaling and expense discipline, and the market will judge that path through closes rather than through press releases.
Alignment between the two clocks is the asymmetry speculators actually want.
Aligned clocks look like this: catalysts arrive, revenue visibility improves, integration milestones become legible. The chart then converts altitude into a higher range through acceptance and retest behavior. Aligned clocks produce tradeable campaigns, since the tape pays for the story while the business earns the right to keep it.
Divergence looks different. The corporate narrative keeps expanding, the acquisition pipeline keeps running, and the tape refuses to convert altitude, since buyers cannot hold the level through time. Divergence produces shelf bleeds, where the business case remains intact while the market drains the late crowd through chop and fatigue. Shelf bleeds can end in breaks or in re-accelerations, since time can either clean the book or shatter it.
The structural frictions that can slow each clock deserve enumeration.
Corporate clock frictions:
- Integration risk across six acquisitions spanning disparate technologies, geographies, and organizational cultures
- Regulatory friction in defense-adjacent transactions, as the mPrest freeze demonstrates
- Capital structure risk from warrant dynamics that amplify volatility and invite opportunistic issuance
- Operating loss risk when gross margin improvements fail to translate into operating leverage
Market clock frictions:
- Magnet zones that trap both sides through oscillation and mean reversion
- Gates that reject breakout theater and punish premature conviction
- Memory zones that compress momentum into churn through emotional supply
- Volatility regimes that punish impatience and reward only disciplined operators
The Phase Map
Phase models refuse prediction and force condition. The current setup reads as a three-phase readiness map across eighteen months, not a promise but a way to identify decision points where the market either converts structure or leaks it.
Phase one is digestion and base-definition.
The low-12s magnet becomes the arena where the chart decides whether this region is a floor or a midpoint of a topping shelf. The tell is not a single candle but the cadence of closes and the behavior after dips. Constructive behavior shows up as controlled pullbacks, higher daily lows, and quick reclaim mechanics. Destructive behavior shows up as repeated rejection attempts into the mid-teens, expanding volatility accompanying downside closes, and a gradual migration of closes lower even when intraday wicks create drama. The backlog surge to $65.3 million supports phase-one stabilization by reducing fear of collapse, but backlog is not revenue until contracts convert.
Phase two is the acceptance attempt and range conversion.
If phase one builds a floor, phase two tests whether that floor can become a higher range. A converted range is not a breakout candle but multi-session acceptance above the prior high area, followed by a retest that holds. The border-protection tender, positioning Ondas as prime contractor for a multi-year program deploying thousands of drones, could provide the catalyst for phase-two conversion if the initial purchase order lands as expected and revenue recognition proceeds on schedule. The $16.4 million in Q4 European airport counter-UAS orders demonstrates demand breadth beyond a single program.
Phase three is maturation or re-rating compression.
Successful acceptance turns phase three into a retest campaign toward the older weekly memory zone in the high teens. Failed acceptance turns phase three into slower drift and deeper rebuild, since the market demands proof through time rather than paying for aspiration. The counter-UAS market, projected to grow from $4.48 billion in 2025 to $14.51 billion by 2030 at 26.5 percent CAGR, provides the secular tailwind that could support phase-three maturation if Ondas captures share. The FAA Part 108 finalization, expected in 2026, could unlock commercial drone demand for the Optimus platform in ways that accelerate the timeline.
The phase map permits fundamental claims to exist without hijacking the analysis. A raised revenue target can support a phase-two acceptance attempt, since expectations can pull buyers through a gate. An integration milestone can support phase-three maturation, since proof through execution reduces the need for adrenaline volume. The same elements can sabotage the phases: a single-customer revenue spike can turn into phase-one fragility if that customer delays, a border-protection tender can turn into phase-two rejection if contract structure disappoints, and a large acquisition pipeline can turn into phase-three compression if integration drags margins and dilutes focus.
Catalysts can be fuel, and catalysts can be heat that reveals weak joints.
Deployment Doctrine
Dual-path forecasting avoids moralizing, and prevents the common sin of speculative writing, where single-path narratives read as persuasion rather than analysis.
The long-path thesis is one of conversion. It requires higher bases, volatility expansions that express as continuation rather than exhaustion, and acceptance behavior above the mid-teens gate that holds through retests. The highest-quality long entry is not a breakout candle but the first controlled retest that holds after acceptance, since structure invites there and emotion fades. A long plan that survives volatility needs a kill switch: decisive loss of the reclaimed level that fails to recover quickly signals a regime flip from digestion to repricing.
The short-path thesis is a failure-to-convert. It requires altitude failure, volatility expansions that express as trapdoor moves, and rejection behavior at the mid-teens gate that produces a push above and a close back below. A short plan needs clear invalidation, since a break above the rejection wick high kills the thesis. A more structural short setup appears if the magnet zone breaks and fails to reclaim within a few sessions, since a failed reclaim confirms that chop has turned into drift.

Scenario weights force discipline and prevent emotional anchoring. Three scenarios suffice for conditional thinking. Scenario A, weighted at 45 percent, covers constructive digestion that converts into acceptance, followed by a retest that holds, followed by a campaign toward the older weekly memory zone. Scenario B, weighted at 35 percent, covers extended digestion trapped in the magnet band, where time-decay dominates and the market waits for execution proof. Scenario C, weighted at 20 percent, covers rejection and trapdoor behavior, where the magnet breaks, reclaim fails, and the market demands a deeper rebuild shelf before any new campaign can be trusted.
A staged deployment plan makes conditional progression explicit:
- Probe: Small initial position only after phase-one behavior looks constructive through closes and reclaim mechanics; a probe that ignores cadence is just a guess.
- Add on acceptance: Increase exposure only after multi-session acceptance above the gate; acceptance is the conversion test, not the headline.
- Add on retest: Further addition on the controlled retest that holds, where structure offers a clear invalidation line.
- Reduce into supply: Trim risk into the first nearby overhead supply pocket; high-volatility names love snapbacks and punish greed.
- Hold for regime: Maintain size only if weekly structure starts printing higher lows after clearing the memory zone; a weekly higher-low sequence is regime evidence.
- Cut on stall: Reduce or exit exposure when stall logic appears; time is the hidden tax, and stalled campaigns consume capital without paying rent.
The non-trade zone deserves explicit identification. The band between primary support and the acceptance gate can become a chop engine when volatility is elevated and direction remains undecided. The highest-expectancy move in that zone is often inaction, since the chart provides just enough motion to feel tradeable without offering structure.
The Referendum on Common Error
Capital is not a substitute for conversion. Capital extends runway, and runway is valuable. Capital also amplifies optionality and encourages management teams to keep assembling rather than to start consolidating. Tapes can punish assembly when they need proof of consolidation. Tapes can also punish consolidation when they are still paying for assembly.
That paradox is why the chart must remain the adjudicator, not the press release.
Defense-adjacent narratives are not permanently bid. A defense narrative can be real and still be mispriced in both directions, since tapes price timing and certainty rather than virtue or necessity. The counter-UAS market can be growing at 26.5 percent annually and still produce losers among the companies competing for share. A border tender can be a huge story and still be a slow revenue-recognition mechanism. A backlog can be large and still be concentrated in ways that create fragility; reports indicate that one customer represented 90 percent of Q3 2025 revenues. A product suite can be impressive and still be integration-fragile in ways that take quarters to reveal.
Volatility is not a feature; it is a tax. It can create opportunity, while forcing operators to pay in discipline. Markets punish sloppy sizing faster than any fundamental development can repair the damage. The traders who survive elevated-volatility environments are not the ones who predict direction best but the ones who structure their exposure to survive being wrong. The 144 million potential dilutive shares create additional volatility risk, since warrant dynamics can amplify moves in both directions.
The risk-reward calculus at current prices tilts toward caution without foreclosing opportunity.
Bulls see upside to $25-30 per share by 2027 if 2026 revenue targets land and gross margins expand to 35 percent, with acquisition by a defense prime at strategic premium providing additional optionality. Bears see downside to $5-8 per share if revenue growth disappoints, integration costs spiral, and the market re-rates to 10 times forward sales, a multiple still generous for an unprofitable company. The base case suggests a 1.5:1 upside-to-downside ratio over twelve to eighteen months, acceptable for growth-oriented portfolios but not compelling for conservative capital.
The question ONDS poses is not whether autonomy matters, nor whether the platform is real. The question is whether altitude can convert into acceptance through time, since the tape already paid for the story once and now demands proof that the story can live on the chart without constant adrenaline. Every speculative instrument eventually asks the same question. Most answer it with shelf bleeds that reward patience and punish enthusiasm. A few answer it with regime shifts that vindicate early conviction.
The chart will reveal which category ONDS occupies. It will reveal it through closes, not through headlines.
Six Strategic Questions for Ondas Inc. Management
These six questions probe four critical risk dimensions that will determine whether the corporate clock and market clock can synchronize:
- Revenue Sustainability (Q1, Q4): Is growth dependent on a few lumpy mega-contracts or diversified across customers and geographies?
- Profitability Path (Q2, Q5): Can the company achieve positive EBITDA at $150-200M revenue, or will continued losses force dilutive raises?
- Execution Capability (Q3, Q6): Can management integrate six acquisitions while scaling operations three-to-four-fold in eighteen months?
- Strategic Positioning (All): Is Ondas building a sustainable independent platform or a near-term acquisition target?
For investors evaluating ONDS at approximately $12 per share, management responses will clarify whether the company represents a compelling asymmetric bet on defense autonomy or an over-hyped roll-up vulnerable to execution risk and multiple compression.
1. Customer Concentration and Revenue Diversification
What percentage of the $65.3 million backlog comes from the top three customers, and how is the company mitigating the risk that 90 percent of Q3 revenues came from a single customer?
Reports indicate extreme customer concentration, with one customer representing 90 percent of Q3 2025 revenues. This creates acute sensitivity to contract delays or cancellations. While the backlog surged 180 percent to $65.3 million, the border-protection tender and European airport C-UAS deployments appear concentrated in government programs. The ambitious $170-180M target for 2026 implies adding approximately $120M in net new revenue beyond current backlog. If a handful of large contracts represent the majority of this growth, any execution delay, program cancellation, or regulatory freeze could materially derail the revenue trajectory and trigger multiple compression.
- Specific breakdown of backlog by customer type: defense, critical infrastructure, rail, and utilities
- Number of customers representing more than 10 percent of backlog
- Contractual protections including multi-year commitments and penalty clauses for cancellations
- Pipeline of medium-sized contracts in the $5-15M range to complement mega-deals
2. M&A Integration and Margin Trajectory
The company has acquired six entities in eighteen months, including Apeiro, Roboteam, 4M Defense, and Sentrycs. What is the integration timeline for achieving operational synergies, and what is the pathway from 26 percent Q3 gross margins to sustainable 35-40 percent margins that justify current valuation?
Gross margin improved dramatically from 3 percent in Q3 2024 to 26 percent in Q3 2025, but Q3 operating margin remained deeply negative at -176.1 percent. With six acquisitions in rapid succession, each bringing disparate technologies across aerial drones, ground UGVs, cyber C-UAS, fiber-optic communications, and demining robotics, integration complexity is substantial. Operating expenses surged to $18.1M in Q3 2025, with $5M in non-cash stock compensation and over $13M in cash operating costs. The market is pricing ONDS at approximately 27x forward 2026 EV/Sales, a premium requiring both revenue execution and a credible path to profitability.
- Product and segment-level gross margin disclosure across Sentrycs cyber, Iron Drone hardware, and FullMAX recurring revenue
- Fixed versus variable operating cost structure and whether operating expenses can grow at less than 50 percent the rate of revenue
- Integration milestones and timeline for unified ERP and back-office systems
- Management’s EBITDA breakeven revenue threshold
3. Roboteam Revenue Composition and Sustainability
Roboteam is expected to contribute at least $30 million in 2026 revenue, representing approximately 17 percent of the total target. How much is recurring support and sustainment versus one-time platform sales, and what visibility exists on multi-year contracts beyond 2026?
The Roboteam acquisition closed in December 2025 for approximately $80M and is expected to deliver $3-4M in Q4 2025 and over $30M in 2026. Roboteam UGVs are deployed in more than 30 countries, and the company recently received over $20M in orders from a major military customer. Defense hardware sales can be lumpy, however, with large initial platform procurements followed by smaller sustainment and spares revenue. If the $30M 2026 revenue is primarily from announced orders plus one-time deployments, the 2027 trajectory becomes uncertain. If a significant portion is recurring support contracts, this provides a stable revenue base.
- Percentage of Roboteam revenue that is recurring through support, spares, and software subscriptions
- Average contract duration comparing one-year agreements to multi-year framework agreements
- Whether the $20M-plus order is a one-time procurement or first tranche of a multi-year program
- Attach rates showing whether Roboteam customers also purchase Ondas aerial drones and C-UAS systems
4. Border-Protection Tender Specifics
The border-protection program involving thousands of drones has been positioned as a major 2026 catalyst with an initial purchase order expected in January 2026. What details are available on contract structure, including total contract value, revenue recognition timeline, and whether this is fixed-price or cost-plus?
The border-protection tender announced in December 2025 positions Ondas as prime contractor for a multi-year, multi-phase program deploying thousands of drones for national border security. No specific contract value or revenue recognition schedule has been disclosed. The phrase “thousands of drones” could imply anywhere from $50M to over $200M in total contract value, but revenue recognition depends on delivery schedules, acceptance criteria, and whether revenue is recognized on delivery or installation. Fixed-price contracts carry margin risk if costs overrun, while cost-plus contracts provide more predictable margins but may grow slower.
- Total contract value or range
- Expected 2026 revenue as a portion of a multi-year program
- Revenue recognition policy covering percentage-of-completion, delivery-based, or milestone-based approaches
- Whether contract includes recurring ISR and software subscriptions or pure hardware sale
- Customer identity to assess geopolitical risk
5. Ondas Networks Roadmap
The FullMAX private wireless business contributed less than 1 percent of Q3 revenues despite holding IEEE 802.16t certification and the FCC railroad mandate creating a forced upgrade cycle. What is preventing faster adoption, and what is the realistic revenue contribution from Networks in 2026?
Ondas Networks, once the core business, has been eclipsed by OAS. Q3 2025 revenue was approximately $0.1M, and management stated revenue expectations for Ondas Networks are modest given delayed network deployments from Class I Railroads. This is surprising given the FCC 900MHz mandate and the IEEE 802.16t standard ratification in May 2025. If Ondas Networks cannot convert the regulatory tailwind into meaningful revenue, it suggests either the technology is not competitive against alternatives, Class I railroads are delaying capital expenditure despite the mandate, or sales cycles are multi-year with revenue arriving in 2027 or later.
- Specific pipeline for railroad deployments and number of Class I railroads in active trials or negotiations
- Reasons for deployment delays covering customer budget cycles, regulatory approval bottlenecks, or competitive pressure
- Expected 2026 revenue from Networks segment
- Long-term strategic positioning and whether Networks is a core business or divestiture candidate
6. Capital Allocation Strategy and Acquisition Pipeline
The company has deployed over $400M in M&A over the past year, including $225M for Sentrycs and $80M for Roboteam, and established Ondas Capital with $150M for strategic investments. With $1.5B in cash, what is the M&A strategy for 2026, and how does management balance M&A against organic growth investment?
Ondas has pursued aggressive acquisition strategy to assemble the OAS portfolio. The mPrest acquisition was frozen by Israeli defense authorities, and discussions with Controp are reportedly ongoing. Ondas Capital was announced with $150M deployment capacity. With $1.5B in pro-forma cash and ongoing cash burn of approximately $52M annually, management has three-to-five years of runway but must balance M&A with organic R&D, sales expansion, and potential shareholder returns. Continued large acquisitions risk further dilution and integration complexity. Strategic acquisitions that add capabilities or customer access could accelerate revenue growth and justify premium valuations. A shift to organic growth signals confidence in the existing portfolio but may slow revenue growth.
- Confirmed M&A pipeline including number of targets under letter of intent and expected close timing
- Acquisition criteria covering target revenue size, margin profile, and strategic fit
- Capital allocation framework showing percentage reserved for M&A versus organic growth versus potential share buybacks
- Ondas Capital deployment status and types of investments
- Exit strategy implications and whether management is building to sell to a prime contractor or pursuing independent scale


Leave a comment