
Most wealth taxes never get tested because they never get passed. California’s proposed Billionaire Tax Act has accomplished something rarer: it has revealed the precise velocity at which capital abandons a jurisdiction when threatened. Within a single month of the announcement, $700 billion crossed state lines. The initiative remains a proposal, months from any ballot, yet the measurement has already begun.
Larry Page converted or relocated more than forty-five limited liability companies to Delaware and Florida in December 2025, purchasing a $72 million mansion in Miami’s Coconut Grove on Christmas Eve. Sergey Brin moved fifteen LLCs to Nevada. Larry Ellison completed the sale of his San Francisco home on December 30 for $45 million, marking the city’s largest residential transaction of the year. Peter Thiel and David Sacks announced residency changes on New Year’s Eve. The departures clustered around a single week because that week determined a decade of tax exposure. These are not abstract statistics; they are forwarding addresses that spell out a map of where capital now prefers to live.
The combined net worth of Page and Brin exceeds $500 billion; their combined potential tax liability under the proposed 5% rate would have exceeded $25 billion. Ellison’s $192 billion fortune would have triggered a $9.6 billion bill. The arithmetic explains the urgency of their calendars. A single week of residency planning saved these three men alone more than $40 billion in potential taxation. The scale of that savings dwarfs the cost of any mansion, any relocation expense, any disruption to routine.
Capital is rational, and rational capital moved.
The Service Employees International Union filed Initiative 25-0024 proposing a one-time 5% wealth tax on California residents whose net worth exceeds $1 billion, with a retroactive effective date of January 1, 2026. The retroactive provision was designed to prevent exactly what happened; the theory was that billionaires could not escape a tax that applied to their status on a date already past. The theory failed because lawyers work faster than legislators anticipated. By the time the proposal became public, the countdown had begun. It ended on New Year’s Eve with a parade of announcements that read like a roll call of Silicon Valley’s founding generation heading for the exits.

Chamath Palihapitiya, a venture capitalist with direct visibility into the region’s wealth flows, documented the contraction in stark terms: California’s billionaire wealth pool fell from approximately $2 trillion to $1.3 trillion within a single month of the announcement. The decline represents permanent erosion rather than temporary repositioning. Once a billionaire establishes residency in Texas or Florida before the cutoff date, the tax cannot reach them regardless of the initiative’s electoral fate. The tax base has become a river delta, with capital branching into channels that flow away from the source and cannot be recalled.
The Speculator’s edge lies in the ability to distinguish between trades that are positioned for geographic reallocation and those that require structural confirmation before conviction scales. This framework therefore sorts eight tickers into three categories based on execution readiness rather than thesis alignment. Two names are ready for immediate deployment. Four names require specific triggers before entry. Two names require breakdown confirmation before shorts activate.
The capital flows are documented, the beneficiaries are identifiable, and the question is not whether to act but when.
Names Positioned for Immediate Entry
Prologis at $133.21 presents the cleanest opportunity among the directional plays. The company owns industrial logistics properties across Texas, including distribution centers in Dallas-Fort Worth and Houston that serve the very companies relocating from California. Every warehouse handling goods for a firm that fled Sacramento represents demand flowing through Prologis assets. When Apple ships components to its Austin campus or its Houston AI server facility, those components move through logistics networks that Prologis properties serve. The connection between billionaire relocation and industrial real estate demand is not metaphorical; it is physical, traceable, and ongoing.
The chart confirms what the thesis implies: institutional buyers have been steadily accumulating shares after the 2022 correction, and the price is now pressing against a level that, if cleared, opens a path toward $150-160. The structure resembles a patient recovering from fever, with vital signs improving and the worst clearly past. The participation is steady rather than episodic, which separates Prologis from speculative names that spike on headlines and fade on silence.
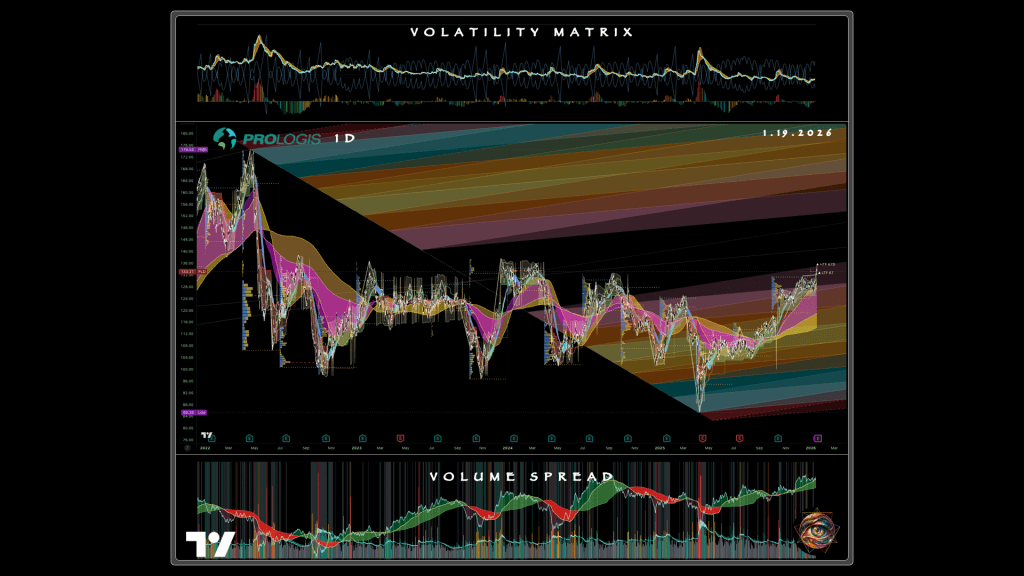
The trade is straightforward. Acceptance above $140 activates the long thesis. Failure to hold $125 invalidates it. The industrial logistics exposure captures nearshoring, e-commerce fulfillment, and the physical infrastructure required to support relocated corporate operations. Prologis does not need California to collapse. It needs Texas to keep absorbing inflows, which the data confirm is already happening. The company reported occupancy rates above 97% in its Texas portfolio during the most recent quarter, a figure that leaves little room for doubt about demand.
The Global X U.S. Infrastructure Development ETF at $51.57 operates in confirmed breakout territory. The Texas Department of Transportation has announced a $148 billion ten-year investment program, with the agency estimating $29.4 billion annually in economic benefits and 71,500 jobs across the project timeline. These are not aspirational figures; they represent appropriated funds flowing through approved projects. Construction firms, engineering consultancies, and materials suppliers flow through this ETF’s holdings, creating direct exposure to spending that has already been authorized and is already being disbursed.
Its chart shows a staircase pattern where each pullback finds support at a higher level than the prior pullback, the kind of structure that rewards patience on dips rather than chasing at highs. The pattern has persisted for years, suggesting that buyers remain organized and willing to defend their positions. This is a mature trend offering reliability rather than excitement. Pullbacks to the $49-50 range offer entry if the breakout holds; loss of $47-48 would signal the trend has failed. The risk is not that Texas stops building but that the market prices in the buildout before it completes.
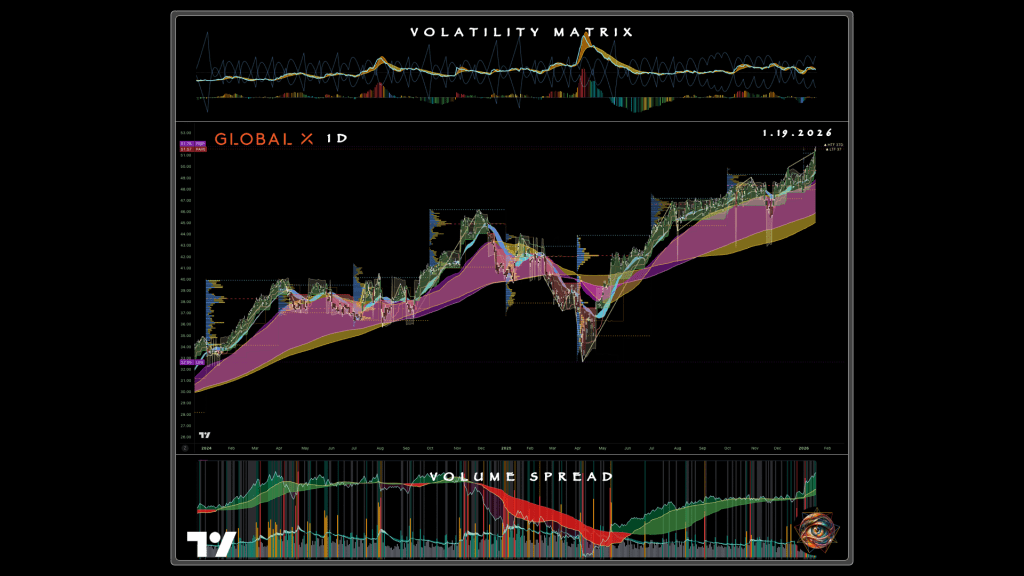
For now, the chart suggests the pricing remains incomplete.
Texas positioned itself as the primary receiving basin through zero state income tax, aggressive infrastructure investment, and deliberate cultivation of technology sector relocations. The state has been running this playbook for years. Oracle moved its headquarters from Silicon Valley to Austin in 2020, Tesla followed in 2021, and the pattern accelerated after the pandemic normalized distributed workforces. The California exodus is not an aberration. Rather, it is the acceleration of a trend that predates the billionaire tax by half a decade.
Google committed $40 billion to three new Texas data centers through 2027. The Stargate AI infrastructure project involves $500 billion in total national investment with multiple Texas sites. Apple’s Austin campus represents a $1 billion investment across 133 acres with capacity for fifteen thousand employees. The Houston facility opening in 2026 will produce servers supporting Apple Intelligence. The buildout is not speculative; ground has broken, steel has risen, hiring has begun. The question for investors is not whether the capital will arrive but how to position for its arrival.
Phase one deployment allocates 40% of target capital to these two names immediately. The structures are ready; waiting for better prices risks missing the move entirely.
Names Requiring Confirmation Before Entry
CleanSpark at $13.37 anchors the power infrastructure thesis, and the thesis is elegant in its simplicity. Data centers consume electricity at industrial scale. A single large AI training facility can draw more power than a small city. The ERCOT grid serving Texas has finite interconnection capacity, and the queue for new connections stretches years into the future.
Whoever controls the power controls the chokepoint through which all expansion must pass.
CleanSpark announced 890 megawatts of aggregate capacity near Houston in January 2026, enough to power approximately 200,000 of the advanced chips used in AI training. The company is positioning itself as an enabler of the buildout by owning the resource that constrains it. Google’s $40 billion Texas data center commitment and the Stargate project’s $500 billion national investment create demand for exactly the kind of power capacity CleanSpark controls. The question is whether CleanSpark can convert that positioning into contracts, the contracts into revenue, and the revenue into stock price appreciation.
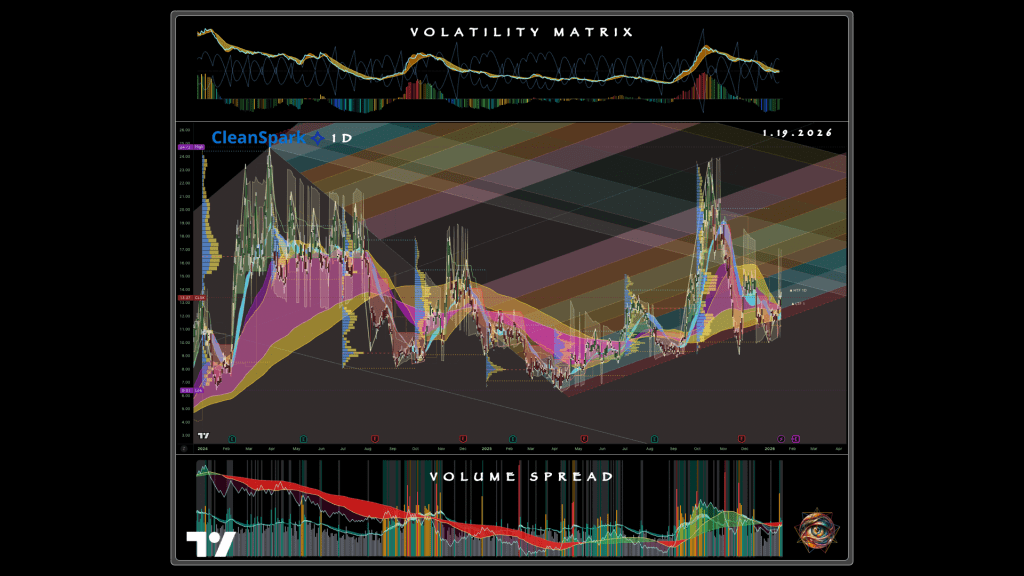
The chart tells a more cautious story.
The stock ran from $6 to nearly $25 in the prior cycle, then collapsed back toward the current level. The rubble from that collapse has not yet been cleared; overhead supply from investors who bought higher and want out will pressure any rally until the stock proves it can absorb that selling. The 28% short interest creates reflexive potential. If the stock rises past certain levels, traders who bet against it must buy shares to limit their losses, which pushes the price higher still, forcing more buying. Still, the squeeze needs a catalyst: a hyperscaler partnership, a Stargate project contract, anything confirming that the 890 megawatts will serve AI infrastructure rather than sit idle.
The trigger is $14.20 for initial interest, $16-17.50 for conviction. Below $10-11, the thesis fails. The resolution window spans two to six months; this is a name to prepare for rather than chase.
Digital Realty Trust at $163.60 functions as institutional-grade exposure to the data center buildout. The Dallas-Fort Worth region now hosts 141 of the nation’s 279 operational data centers, a concentration that reflects both the region’s power availability and its central geographic position for serving traffic across the continent. Digital Realty owns significant share of that footprint, with campuses that house servers for some of the largest technology companies in the world.
Google’s $40 billion commitment to three new Texas facilities through 2027 and the Stargate project’s $500 billion in national investment create demand tailwinds the company is positioned to capture. The customers signing leases today are not speculating on future AI demand; they are building capacity for products already in development, products that will require compute resources measured in exaflops rather than teraflops. Digital Realty provides the physical envelope for that compute.
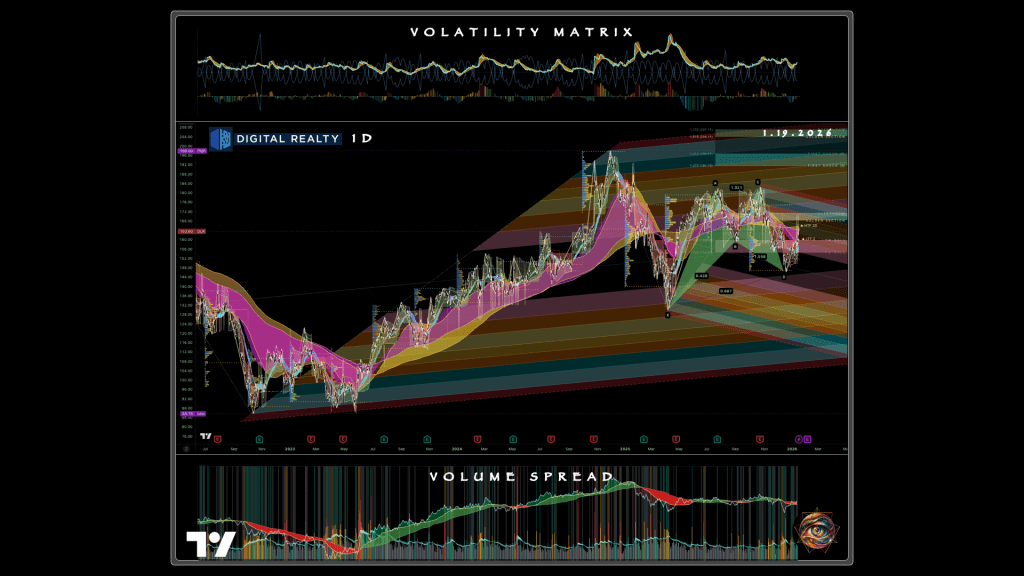
The chart shows a name stuck between buyers and sellers, with neither side willing to commit.
The stock reached $198 last cycle and has been digesting that move ever since, rotating in a range that rewards neither bulls nor bears. The indecision resolves when price breaks above $175 or fails below $145, and the direction of the break determines whether this becomes a buy or remains a pass. The current position in the middle of the range offers poor odds; the range tends to produce churn that erodes capital without providing directional clarity. Patience serves better than aggression here.
Equinix at $801.78 presents the strongest underlying structure of any name in this set. The company has rewarded patient investors for two decades, surviving the dot-com crash, the financial crisis, and the 2022 rate shock while continuing to reach higher prices over time. This is the kind of track record that earns the benefit of the doubt; when a company has navigated that many crises without breaking its uptrend, the presumption shifts in favor of continuation rather than reversal.
The chart suggests that pattern remains intact, with the current consolidation appearing as a pause within a larger advance rather than a termination. The $840-880 zone is the decision point; acceptance above activates the path toward the prior high near $994 and potential new territory beyond. The company’s interconnection revenue model, where customers pay not just for space but for the ability to connect directly to other customers within the same facility, creates switching costs that support pricing power and margin stability.
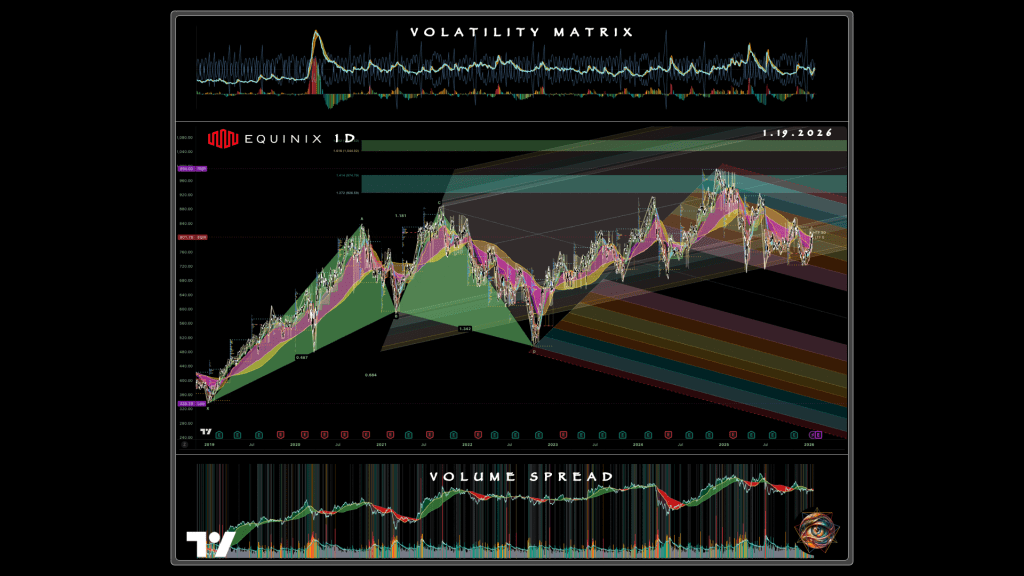
The caveat is location within the range. The stock currently sits in a band where neither buyers nor sellers have the upper hand, the kind of zone that produces false signals and whipsaws. Entry on a pullback toward $740-780 offers better odds than chasing at current levels.
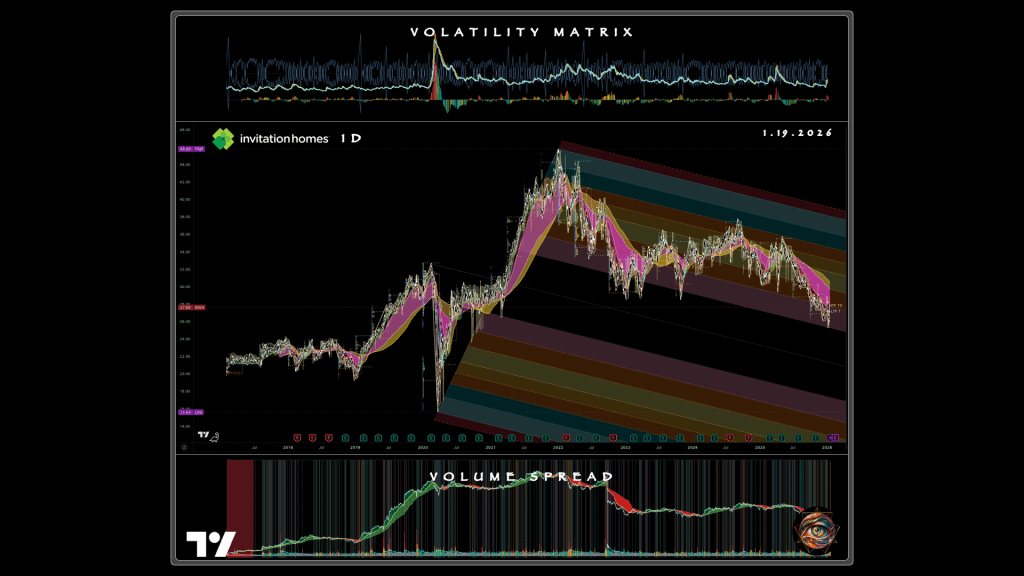
Invitation Homes at $27.65 captures residential demand from relocated workers through single-family rentals concentrated in Dallas-Fort Worth, Houston, and Austin. The thesis is intuitive: every engineer who moves from Cupertino to Austin needs housing, and single-family rentals serve a demographic that wants space without commitment to a thirty-year mortgage in an unfamiliar market. The 7.7 million people who fled Venezuela since 2014 included many who ended up in Texas; the engineers fleeing California’s tax regime will add to that demand in neighborhoods where Invitation Homes owns properties.
The chart does not yet confirm the thesis.
The stock has been declining since 2022, making lower highs in a persistent channel that rewards sellers on rallies. The current position near the channel floor creates a decision point: either the floor holds and a grind toward $31-35 begins, or the floor fails and the stock falls toward $22-24. The fundamental demand may exist, but the chart shows supply that has not yet been absorbed. Investors who bought at $40 or $45 are still looking for exits, and their selling pressure caps every attempted rally. A sustained hold above $31 would shift the picture; until then, the trade requires patience.
Phase two deployment allocates 40% of target capital to these four names upon confirmation at their respective trigger levels. The catalyst calendar governs timing. Apple’s Q1 earnings in late January may validate Texas expansion through commentary on Austin hiring or headcount shifts from Cupertino. SEIU signature certification in late February will confirm ballot qualification and potentially accelerate departure announcements from billionaires who had been waiting for certainty about the initiative’s viability. California’s budget revision in May will quantify the deficit impact of the exodus, potentially triggering credit rating agency responses that further pressure California-exposed assets. The November ballot vote functions as the terminal catalyst for the cycle.
Names Requiring Structural Failure for Short Entry
Kilroy Realty at $37.70 represents the California office short thesis. The company’s West Coast concentration in San Francisco and San Diego creates direct exposure to tech exodus and remote work persistence. Office vacancy in San Francisco has reached levels not seen since the early 1990s, and the tenants who left are not coming back; they discovered during the pandemic that they could operate from Texas or Florida or anywhere with broadband, and many chose to make that discovery permanent. The sublease market in San Francisco remains flooded with space that companies leased before 2020 and no longer need.
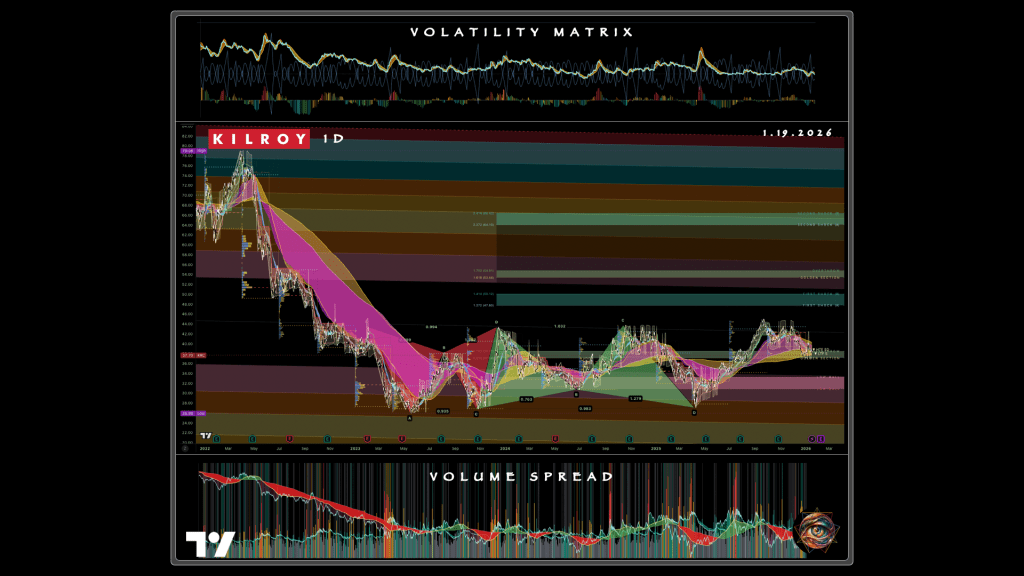
The chart shows a name that has been declining for years but has not yet broken down decisively. The stock is stuck in a repair range, bouncing between support and resistance without committing to either direction. The short thesis activates when that support fails—specifically, when the $31-33 zone gives way and selling accelerates. Until then, the middle of the range offers poor risk-to-reward for shorts just as it does for longs. Shorting a stock that is already down 60% from its highs carries the risk of a squeeze if any positive catalyst emerges; the better entry comes after the structure confirms that sellers remain in control.
Alexandria Real Estate Equities at $57.89 provides the life science and technology campus angle on the California short. The company built its business around the idea that biotech and tech companies want purpose-built campuses in innovation clusters, with San Francisco, San Diego, and Boston as the primary markets. The thesis worked brilliantly for a decade. The pandemic and its aftermath broke something in that thesis; the same companies that once paid premium rents for the privilege of clustering near other companies discovered that their scientists could collaborate over Zoom and their engineers could code from anywhere.
The chart tells a stark story: the stock peaked above $224 in 2022 and has been falling ever since, losing more than 70% of its value in a decline that accelerated rather than moderated as time passed. The overhead supply from investors who bought higher creates a glacier that presses down on every attempted rally. Years of accumulated losses sit above the current price, and those losses belong to investors who will sell into any strength to recover what they can.
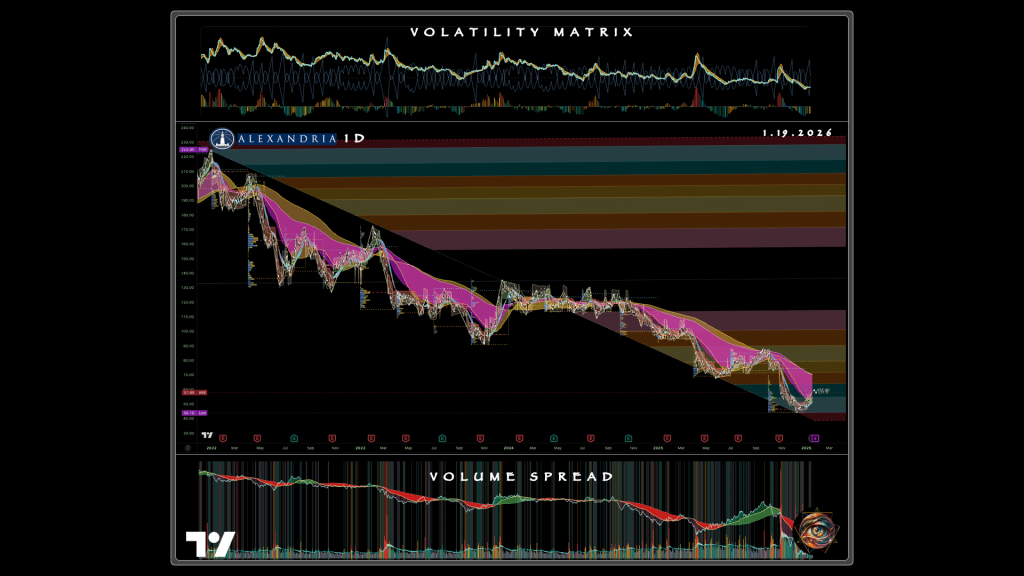
The recent bounce from the $44-46 lows looks like exhaustion rather than reversal, a reflexive snap after the selling temporarily exhausted itself. The short thesis requires rejection at the current $57-60 zone and sustained trading below $50 to confirm that sellers remain in control. The $44-46 floor defines whether the base holds or fails into a fresh leg lower. The weekly trend remains down; the burden of proof lies with the bulls.
Phase three deployment allocates the final 20% of target capital to short positions upon structural failure confirmation. The November ballot vote is the terminal catalyst; passage accelerates the exodus and pressures California commercial real estate further, while failure provides temporary relief that creates better short entry on the subsequent rally into resistance.

The Pressure Test
Three scenarios govern how this trade unfolds, each with different probability weight and different implications for position management.
The managed reallocation scenario carries 50% probability. The billionaire exodus continues through 2026. The tax either fails at the ballot or survives court challenge but collects less revenue than projected because so much of the tax base has already departed, and Texas infrastructure absorbs the inflows without significant oversupply. In this scenario, the positioned names reach their targets, the confirmation names trigger and advance, and the shorts activate on structural failure.
Portfolio return: 30-45% over eighteen months.
The policy reversal scenario carries 30% probability. Voters reject the billionaire tax in November 2026, or courts strike it down before the election on constitutional grounds, reducing urgency for additional departures. The relocations already completed remain permanent—Page is not moving back to California, and neither is Brin or Ellison—but the catalyst pressure diminishes for those who had not yet moved. California commercial real estate stabilizes rather than collapses; the shorts do not trigger. The Texas longs perform but with muted returns as the demand surge moderates.
Portfolio return: 15-25% over eighteen months, concentrated in infrastructure rather than individual names.
The structural overshoot scenario carries 20% probability. Texas absorbs too much capital too quickly, creating oversupply that mirrors what California experienced. Austin office vacancy, already elevated at 24-25%, spreads contagion into industrial and multifamily as developers who broke ground during the boom deliver projects into a market that has absorbed all it can. The longs that triggered on confirmation give back gains; the shorts that activated face rallies that test discipline.
Portfolio return: -5% to +10% over eighteen months, depending on risk management execution.
The behavior that would confirm each scenario is observable in real time. Managed reallocation shows the positioned names clearing their trigger levels and continuing higher on steady participation. Policy reversal shows the confirmation names failing at their triggers and returning to range while the shorts consolidate without breaking down. Structural overshoot shows the positioned names reaching targets and then reversing as new supply announcements appear in Texas commercial real estate filings and occupancy data begins to soften.
Those holding positions from the Venezuela Reconstruction Trade portfolio should note overlapping Texas exposure.
The defense contractors in that thesis benefit from the same infrastructure buildout that supports this thesis, particularly those with San Antonio aerospace presence. Position sizing should account for correlation; a full allocation to both portfolios doubles Texas concentration in a way that amplifies both upside and downside. The prudent approach reduces allocation to overlapping names or treats the combined position as a single Texas infrastructure play with diversified expression across real estate, power, and defense.
The Permanent Auction
The California billionaire tax did not cause the exodus. It revealed that the exodus was already possible. The deeper structural truth is that agglomeration advantages have eroded across all jurisdictions. The network density, regulatory familiarity, and talent concentration that once made Silicon Valley departure unthinkable have diminished as remote work normalized and competing states invested in their own infrastructure.
The same forces enabling billionaires to relocate in a week enable:
- companies to distribute operations across multiple states
- workers to perform functions from anywhere with broadband
- capital to flow toward opportunity rather than tradition
Texas is not a destination, but the current bid in an auction that never closes.
The state offers zero income tax today, but that offer is a policy choice rather than a constitutional guarantee. The infrastructure buildout that makes Texas attractive requires continued investment that requires continued revenue. The risk is that the state could eventually require taxation of the wealth it has attracted. Florida offers the same proposition with different constraints. Nevada offers proximity to California without California’s burden. This competition among states for mobile capital has no equilibrium because the capital itself selects for mobility. The billionaires who chose Texas in December 2025 chose it because it was the best option available at that moment.
If a better option emerges, they will choose again.
The commercial real estate arbitrage operates on the same logic. California office properties trade at distressed valuations because tenants discovered that they can operate elsewhere. Texas industrial properties trade at premium valuations because logistics networks require physical presence, at least for now. The spread captures the difference in demand, yet demand itself is a function of decisions that can reverse. The same technology enabling California departure enables Texas departure if circumstances change. The work-from-anywhere revolution that hollowed out San Francisco’s office towers could hollow out Austin’s if another jurisdiction offers better terms to the next generation of founders.
Anyone profiting from this trade will eventually face the question the billionaires faced: when does the current location favor departure? Pattern recognition applies not only to entry but to exit. The confirmation signals that indicate accumulation in one phase indicate distribution in another. The charts do not distinguish between California and Texas, but between acceptance and rejection, between support that holds and support that fails, between participants who are building positions and participants who are liquidating them. The skill is not knowing which state wins, but in recognizing when the market has made its decision and positioning accordingly.
The measurement continues. The auction continues. Every geographic advantage is temporary, and the only durable edge is recognizing that truth before the crowd.


Leave a comment