
The Golden State, consuming 1.8 million barrels of oil per day while producing fewer than 260,000, has spent the last eighteen months figuratively discovering what happens when an estuary loses its freshwater. For decades, California’s fuel supply chain functioned as a brackish ecosystem, sustained by the mixing of two input streams.
- Freshwater: domestic crude production from Kern County and the San Joaquin Valley
- Saltwater: imported oil arriving by tanker from the Middle East, S. America, Alaska
Refineries, pipelines, truckers, and consumers evolved to thrive in that specific salinity. The state then systematically dammed the freshwater inflows through permitting restrictions, setback laws, and regulatory hostility so thoroughgoing that Valero’s CEO described California as the most punishing enforcement regime in North America. The saltwater fraction rose. The ecology began to reorganize. Species adapted to the brackish mix started dying, and organisms that can tolerate pure brine began colonizing the vacant niches.
The experience suggests two takeaways.
The first is a framework for recognizing when infrastructure decline crosses the threshold into self-reinforcing collapse. There are three nonproprietary leading indicators—California Public Utilities Commission (CPUC) filings, Federal Motor Carrier Safety Administration (FMCSA) enforcement letters, and quarterly earnings calls. These apply to any infrastructure-dependent sector facing regulatory pressure.
A second takeaway, an opportunistic alternative to doomscrolling, is a method for constructing trades from structural dislocations. Therefore this speculative analysis corroborates transcripts from Steve Layton of E&B Natural Resources, FreightWaves reporting on FMCSA enforcement, and broader coverage of Assembly Bill 5’s impact on independent truckers. The elaboration traces second- and third-order consequences that the transcripts only gesture toward. Trade ideas are not financial advice, but proofs-of-concept, built on verified (but fluid) catalysts.
The Riverbed Goes Dry
How San Pablo Bay Pipeline Went from Infrastructure to Artifact
The San Pablo Bay Pipeline did not die suddenly. It lost flow the way a river loses volume when tributaries are dammed upstream, each reduction invisible from the bank until the streambed lies exposed. Crimson Midstream’s CPUC presentation from November 2025 documented a 44% volume collapse in six months, from a Q1 2025 average of 64,600 barrels per day to 36,400 by June, and then further to 29,600 by autumn. By December, shippers had nominated zero barrels. The pipeline’s economic minimum throughput sat between 60,000 and 65,000 barrels per day, according to consultant Turner, Mason & Co., which meant that Crimson had been operating at roughly half its break-even for months while hemorrhaging $2 million monthly. The emergency tariff request of $3.75 per barrel, representing Crimson’s cash-cost floor at reduced volumes, arrived too late and attracted no shipper commitments.
The riverbed was dry before anyone thought to measure the flow.
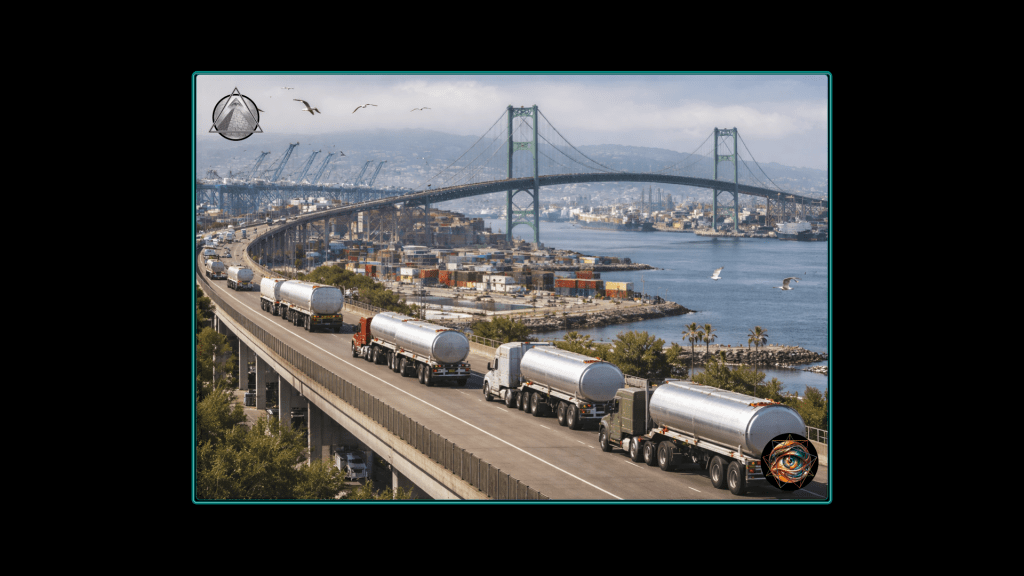
Layton’s testimony corroborates every structural detail. His field at Poso Creek was producing 5,000 barrels per day, all of which had flowed via San Pablo to Bay Area refineries until Valero Benicia canceled its crude contracts in the fall of 2025. The cancellation stranded 30,000 barrels per day of Kern County crude, half of which now moves by truck at a cost of $5 per barrel for the 100-mile round trip to western Kern County pipeline stations, or $8 to $10 per barrel for the longer haul over the Grapevine to Los Angeles refineries.
The trucking solution is the ecological equivalent of carrying water in buckets from a distant source, a caloric expenditure that approaches the nutritional value of what arrives. Approximately 100 additional tanker trucks now traverse Kern County roads every day, producing emissions that California’s regulators do not count against the state’s climate targets because they are categorized as transportation rather than production. This bureaucratic irony between California’s zero-flaring regime and the venting practices of Middle Eastern and South American producers is mildly devastating.
The refinery closures that triggered the pipeline’s collapse form their own cascade, a sequence of species die-offs in the estuary’s most sensitive zone:
- Phillips 66 confirmed permanent cessation of crude processing at its 139,000-barrel-per-day Los Angeles refinery by the end of 2025, absorbing a $230 million charge and laying off 277 workers.
- Valero’s Benicia facility, with a throughput capacity of 145,000 barrels per day and roughly 9% of California’s crude oil capacity, formally notified the California Energy Commission in April 2025 of its intent to idle by the end of April 2026.
Governor Newsom’s January 2026 statement acknowledged the closure while emphasizing Valero’s commitment to import gasoline via the Benicia port infrastructure. This conversion will employ fewer than 100 workers at a site that previously supported more than 400 direct employees and 1,200 indirect jobs. The combined loss of Phillips 66 and Valero Benicia erases 284,000 barrels per day of refining capacity, representing 17% to 20% of statewide throughput.
California’s refinery count has fallen from 23 facilities capable of producing CARBOB-specification gasoline in 2000 to nine.
The remaining refineries are not immune. They are the last brackish-adapted organisms in an estuary whose salinity rises by the quarter. PBF Energy’s Martinez facility, the sole surviving pipeline-connected refinery in the Bay Area after Valero’s departure, suffered a fire on February 1, 2025, that reduced operations to 85,000 to 105,000 barrels per day for nearly a year. Full restart is now targeted for early March 2026. Chevron’s El Segundo and Richmond refineries continue operating, yet Chevron has made no public commitment to indefinite California operations, and the regulatory environment that drove Valero’s departure applies equally to every remaining operator. The state’s Bay Area Air Quality Management District levied an $82 million fine against Valero for violations dating back to 2003, a penalty that functioned less as enforcement and more as an accelerant for the organism’s flight from a habitat it could no longer tolerate.

The Migration Corridors Close
Federal Enforcement Meets State Defiance on the Question of Who May Drive
California’s trucking crisis operates on two fronts simultaneously, and the convergence of Assembly Bill 5 with FMCSA’s CDL enforcement action closes two migration corridors at once. In the estuary’s ecology, truckers are the migratory species that circulate nutrients through the system; AB5 blocks one corridor by eliminating the independent contractor model that sustains 70,000 owner-operators, while FMCSA threatens to seal the other by invalidating the credentials of all 700,000 California CDL holders if the state refuses to address 17,000 improperly issued non-domiciled licenses.
The two pressures are mechanically independent; their synergy is ecological rather than designed.
AB5’s ABC test, codified in 2019 and enforced against trucking since June 2022 after the Supreme Court declined certiorari, creates an impossible geometry for the carrier-driver relationship. Under AB5, a worker is presumed to be an employee; the hiring entity must prove all three prongs of the ABC test to classify someone as an independent contractor.
- (A) The worker is free from the control and direction of the hiring entity in connection with the performance of the work, both under the contract and in fact.
- (B) The worker performs work that is outside the usual course of the hiring entity’s business (i.e., not core, revenue‑generating activities).
- (C) The worker is customarily engaged in an independently established trade, occupation, or business of the same nature as the work being performed.
Prong B requires the hiring entity to prove that the contracted worker performs work outside the usual course of the entity’s business. A trucking company’s usual course of business is moving freight by truck. A trucker moves freight by truck. The prong does not test whether the worker is genuinely independent; it tests whether the worker’s function differs from the company’s function.
For any trucker, working for any carrier, the answer is always no.
The Owner-Operator Independent Drivers Association recognized this in its Ninth Circuit brief, arguing that Prong B effectively prohibits an entire sector of small-business truckers from operating in California, not because of anything the truckers did wrong, but because the test’s geometry makes compliance structurally impossible. There is no cost truckers can absorb, no administrative restructuring they can undertake, and no operational concession they can offer that changes the outcome. The question is rigged before it is asked.
Before Dynamex (2018) and AB5 (2019), California used the Borello test, an eleven-factor contextual evaluation that most owner-operators could satisfy because it asked whether the worker was genuinely independent in practice. AB5 compressed eleven factors into three binary gates, and the second gate changed the outcome for trucking specifically. Borello examined behavior. Prong B examines category. The shift is itself an ecological event, a change in habitat chemistry that the resident species cannot adapt to because the new chemistry is incompatible with its biological structure. A species can develop tolerance for rising salinity by evolving new metabolic pathways. It cannot survive a habitat that has redefined survival to exclude its phenotype. The companies cited in the first enforcement actions did not fail to comply. They discovered that compliance was definitionally impossible.
Prong B does not raise the cost of operating as an independent trucker in California; it eliminates the classification entirely.
Enforcement has now begun in earnest. The California Labor Commissioner’s Office cited Mega Nice Trucking, Ryder Last Mile, and Costco Wholesale in late October 2025, marking the first confirmed AB5 trucking enforcement action. Landstar System, which relies on 11,000-plus owner-operators nationally, instructed its 365 California-based operators to relocate or cease contracting. The operational cost increase for carriers that reclassify drivers as employees runs between 20% and 30% when payroll taxes, health insurance, workers’ compensation, and benefits are included. California Intermodal Associates, a family-owned company operating for nearly 25 years, cited AB5 as the direct cause of its closure after conversion costs rose 30%.
The FMCSA confrontation closes the second corridor with a different mechanism.
A 2025 Annual Program Review found that approximately one in four non-domiciled CDL records sampled in California failed to comply with federal regulations. This includes licenses issued with expiration dates extending years beyond drivers’ authorized employment periods. Secretary Sean Duffy’s preliminary determination threatened withholding of $160 million in federal highway funds.
This raises the possibility of full CDL program decertification under 49 U.S.C. § 31312. Decertification, which has never been imposed on any state, would prohibit California from issuing, renewing, transferring, or upgrading any commercial learner’s permit or CDL until FMCSA determines compliance has been restored. The California DMV delayed cancellations of 17,000 non-domiciled CDLs to March 6, 2026, prompting Duffy to accuse Newsom of lying and the Asian Law Caucus and Sikh Coalition to file a class-action lawsuit arguing that administrative errors, not driver fraud, caused the mismatches.
FreightWaves reporting noted that California appeared poised to defy federal directives by reissuing the very licenses FMCSA had ordered revoked, a posture that makes full decertification more plausible than anyone assumed six months ago. The evidence of ecological succession is already visible in the port data. Over 70% of drivers serving the Ports of Los Angeles and Long Beach are independent owner-operators, the same population AB5 targets. Those ports handle 40% of American container imports. West Coast ports’ share of U.S. import containers has already fallen from roughly 35% in 2021 to 30.5% by 2025, as importers divert cargo to Houston, Savannah, and New York to hedge against California’s instability. This is not a temporary rerouting; it is species migration.
Once a new organism colonizes a niche, the prior occupant rarely returns even if conditions improve, because logistics networks, like ecosystems, stabilize around their current inhabitants and resist reversion to prior states.

The Snowpack No One Will Release
Kern County’s Oil Fields Are Not Depleted … They Are Dammed
Layton’s testimony on Poso Creek Field dismantles the academic argument that Kern County lacks meaningful reserves. The field was declared functionally dead by every major oil company that had owned a piece of it between 1986 and 2000, at which point cumulative production stood at 80 million barrels against an estimated 600 million barrels of oil in place. E&B Natural Resources acquired most of the field, invested in staged development, and lifted production from a few hundred barrels per day to nearly 15,000 at peak, adding 30 million barrels of cumulative output in 25 years without any development activity since the first quarter of 2020. The field still produces 5,000 barrels daily, five years after the last well was drilled. Layton’s observation that many California oil fields have produced only 20% of their oil in place is not an outlier claim; it is a standard characteristic of heavy oil reservoirs where enhanced recovery techniques, particularly steam injection, can unlock additional decades of production.
The freshwater is there, stored in the headwaters like snowpack visible from satellite. The dams will not release it. SB 1137, the setback law imposing 3,200-foot buffer zones between new wells and sensitive receptors, remains in litigation after a voter referendum paused its enforcement. SB 237, signed by Newsom in September 2025, restored environmental clearance for Kern County to resume local oil permitting and resulted in approximately 2,000 approved well permits. Operators remain hesitant to deploy capital at current economics: California crude trades in the low $50s per barrel, down from $70 six months earlier, and the differential between local prices and global benchmarks has widened from 3% to roughly 13%, a spread that reflects the logistical penalty of selling into a collapsing infrastructure.
Operators face the constant threat that a single legislative session could render their investments stranded, such that the capital required for multi-year field development cannot be justified against a one-year political horizon.
The irony completes itself when the estuary’s managers drain the freshwater aquifer and then truck in saltwater from overseas to fill the same reservoir, at greater cost and with greater contamination. Layton’s point is corroborated by Representative Vince Fong’s December 2025 warning and a University of Southern California study; Imported oil carries higher lifecycle emissions when tanker transport across the Pacific and looser production standards in source countries are factored in. California’s climate accounting excludes these emissions because they occur outside state boundaries, a jurisdictional sleight of hand that allows the state to report declining in-state production emissions while the actual carbon footprint of its fuel consumption rises.
The state now imports roughly 60% of its crude from foreign sources, up from 5% three to four decades ago, and the oil industry’s $330 billion annual contribution to state GDP continues to shrink not because the resource is exhausted, but because the political class has decided that extraction is incompatible with its brand.

Six Trades for the New Salinity
Positions on Which Organisms Survive, Which Adapt, and Which Corridors Gain Traffic
CAVEAT EMPTOR: These slides are NOT financial advice. Rather, they are provided as proofs-of-concept. For convenience, the forward horizon is 18 months. For study purposes, the set is ranked by complexity of execution. Always exercise proper position sizing and a precisely defined risk management plan in any live trading. Never trade more than you can comfortably afford to lose.
Is optimism a viable hedge against a system that has begun to consume itself from the inside?
The risk to manage is not whether California’s energy infrastructure will shrink, but will it shrink slowly enough for the surviving organisms to adapt, or has the salinity already passed the point of no return, transforming what traders see as speculative opportunity into what ecologists recognize as extinction?
Every analysis of California’s energy crisis implicitly assumes that the system reaches a new equilibrium: fewer refineries, more imports, higher prices, yet a functioning market. Layton uses the word “cliff.” Other reports cite “death spirals.” Both frame these as risks to be mitigated rather than outcomes already in motion. The possibility to consider is that California’s estuary has already passed the salinity tipping point, the threshold at which the old brackish ecology cannot be restored even if the freshwater inflows resume.
If the degradation accelerates into genuine regime shift, these ideas still profit, yet the consequences extend well beyond any portfolio. Military fuel supply for 30-plus California bases becomes a national security question. The state that once produced a million barrels per day becomes an energy island, importing 100% of its fuel at the mercy of transoceanic supply lines it cannot control and storms it cannot forecast.
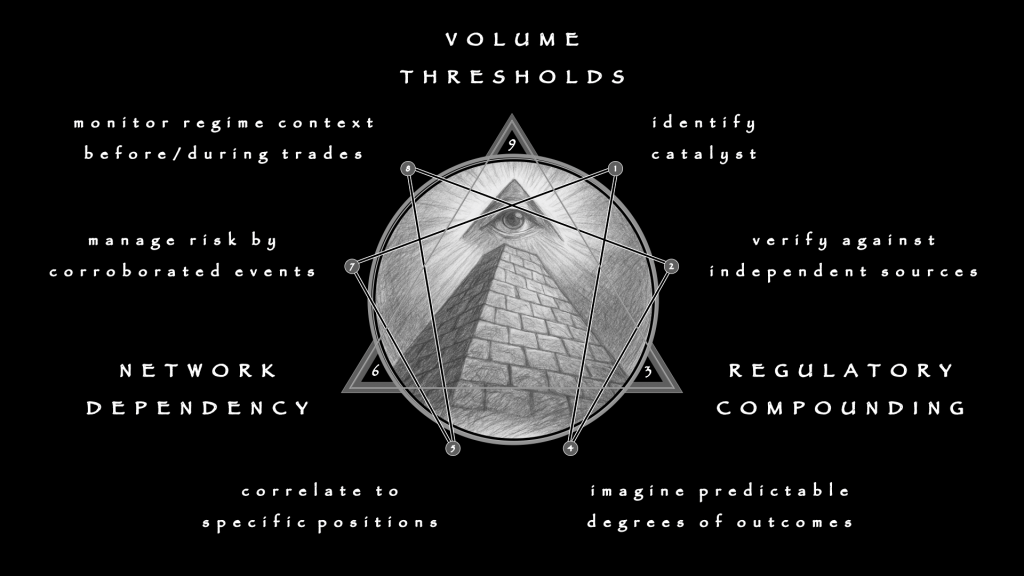
These six trade ideas are built on the premise that systems degrade gradually and unevenly, creating winners among those positioned at the remaining chokepoints. What follows assumes appropriate risk tolerance. Each is anchored in a specific, corroborated catalyst rather than a generalities. Each demonstrates one or more distinct elements of the method:
- identify a catalyst
- verify it against independent data
- imagine predictable positive and negative outcomes
- select an instrument that captures the dislocation
- manage risk according to catalyst evolution, not price
- monitor regime context while capital is committed
Supplementary ratio pairs are identified for each, with reasoning and chart annotations to make the context visible.
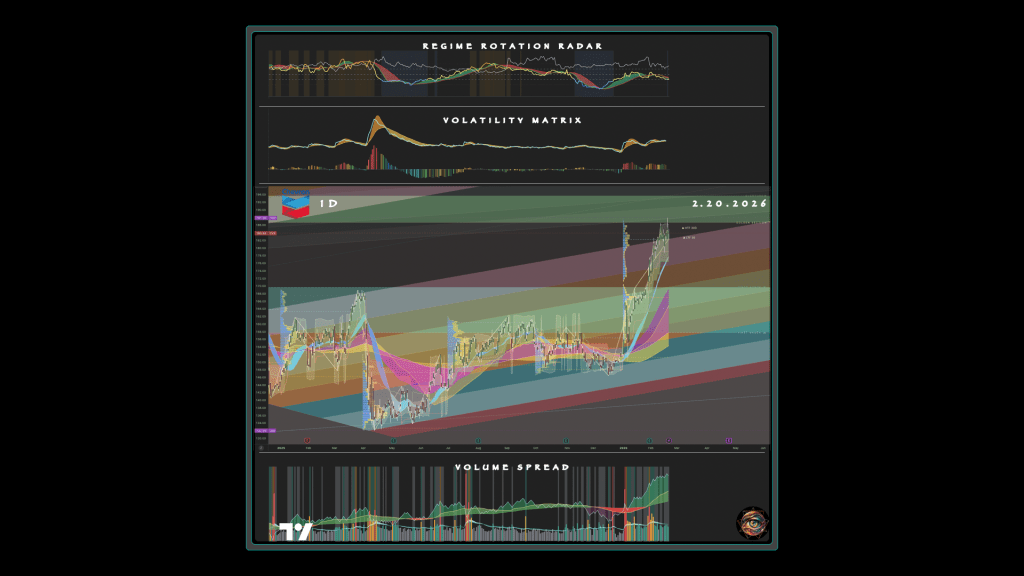
Trade 1: Long PBF Energy (PBF), the Last Brackish Survivor in the Bay
Instrument:
PBF Energy Inc. (PBF), common equity, long directional position accumulated on pullbacks to structural support.
Thesis:
PBF’s Martinez refinery, at 157,000 barrels per day of nameplate capacity, becomes the sole Bay Area refiner when Valero Benicia idles in April 2026. The company has guided West Coast throughput of 280,000 to 300,000 barrels per day for 2026, reflecting confidence in Martinez’s full operational return by March 2026 after the February 2025 fire. Insurance reimbursements in 2025, combined with a Refining Business Improvement program, provide financial cushion. The obvious catalyst here is the Valero Benicia closure, compounded by the summer driving season that immediately follows. The unknowable is whether California’s regulatory apparatus imposes windfall penalties before PBF can capture the margin, or whether an operational incident at Martinez destroys the thesis before the catalyst fires.
In the estuary’s terms, this is the last organism adapted to the brackish mix, suddenly inheriting the entire niche as every competitor dies or flees.
Catalysts and Monitoring:
- April 2026: Valero Benicia closure (CPUC filings and refinery decommissioning timeline for delays or reversals).
- March 2026: PBF Martinez full restart (quarterly earnings and refinery utilization for operational confirmation).
- Summer 2026: driving season demand spike (EIA PADD V gasoline inventory for confirmation of supply tightness).
Entry / Exit Logic:
The PBF trade demonstrates catalyst identification, where a dated, verifiable event creates a supply vacuum with a known timeline. Entry is warranted on pullbacks as low as $27, ahead of the April closure. Accumulate in thirds across the $27 to $34 zone if the catalyst timeline remains intact. The exit target sits at $40 to $45, or on any California legislation imposing windfall profit penalties on refiners. Take profits at fifty percent of the position if $40 is reached before July; hold the remainder through the summer driving season.
Close entirely on any California legislation imposing windfall profit penalties on refiners, regardless of price.
Invalidation:
A stop-loss at $22 represents a break below the post-fire recovery trend and signals that the market has found a reason to discount the niche-inheritance thesis. If PBF/VLO fails to improve after the Benicia closure is confirmed, the market is pricing in operational risk that the thesis has underweighted. Reduce position by half and tighten the stop to $26.
Risk Management:
The primary risk is operational. PBF’s Martinez and Torrance refineries are aging facilities prone to unplanned outages, and any significant downtime during the supply-tight summer would simultaneously spike California fuel prices and collapse PBF’s ability to capture the margin. The raw ATR of roughly 5.7% of the stock price, the widest among the six trades, calls for stops set at structural levels rather than percentages. Cap position size to account for this elevated volatility; one R should not exceed 2% of portfolio value.
Pair with the Chevron trade to hedge against California-specific operational risk, since vertical integration provides exposure to the same supply tightness and mitigates single-refinery concentration.
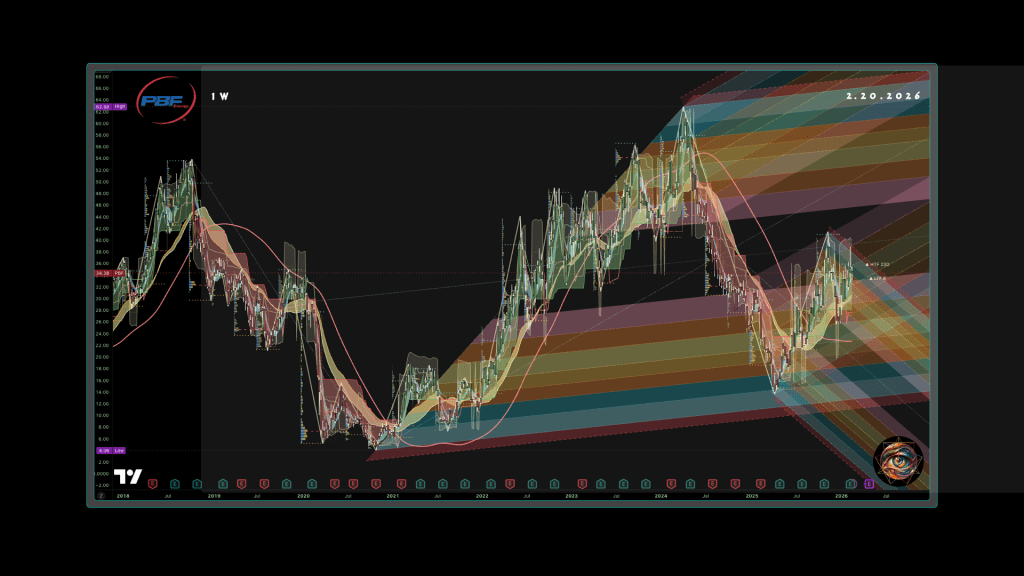
Price Action:
The seven-year structure shows a history of violent cyclical swings. A decline from $53 to $4.06 during the 2020 COVID crash was followed by a refining supercycle that carried it back to $62.88, then another halving to the $13.62 fire-related low. The current price sits almost exactly at the midpoint of the range, a level that functions as the equilibrium price around which the stock’s long-term valuation oscillates.
A large ascending fork drawn from the 2020 low through the 2022-2023 highs shows price currently testing the lower median line, which has acted as support on multiple prior occasions. The SUPeR TReND shows that the weekly trend has been constructive for nearly six months. A weekly close below $28 would constitute a structural failure of the entire post-fire recovery and would warrant exiting the position regardless of the catalyst timeline.
The daily chart reveals a stock that has spent two years building a massive mean-reversion structure after its 2022-2023 refining supercycle. Recovery from the low has been constructive in character if not in velocity. Moving Averages tell a nuanced story of post-fire recovery and a genuine structural regime change rather than a dead-cat bounce. All three braid components are bullish, yet the Silver Thread’s compression warns that the stock needs a catalyst to propel it through the $36 resistance zone.
The Valero Benicia closure in April provides exactly that catalyst.
Pitchforks show price currently trading within a narrowing wedge formed by descending resistance from the 2024 highs and ascending support from the 2025 lows. Convergence sits near $34 to $36, meaning that the next four to six weeks represent a decision point. A breakout above $36.18 on expanding volume would confirm the thesis; a rejection and close below $30.75 would invalidate it.
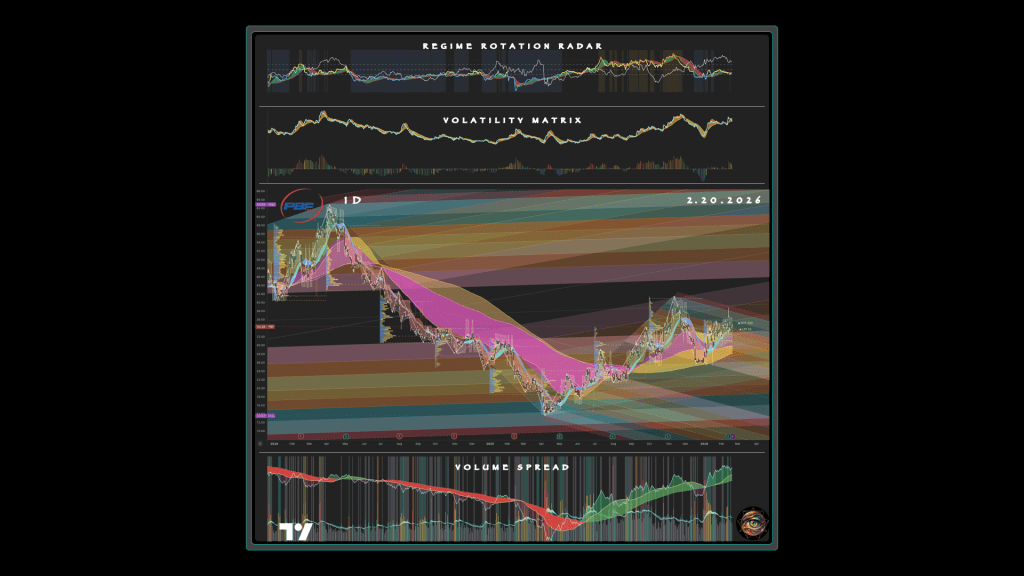
Volume Spread Analysis:
Daily volume sits below both the 21- and the 34- period EMAs, confirming that the recovery has not yet attracted momentum-driven participation. The OBVX cloud has transitioned from deep red distribution through 2024 into a green accumulation zone by late 2025, the signature of institutional repositioning at lower price levels. OBVX readings remain negative, yet both the short and the long MA are rising, indicating improving On-Balance Volume despite the negative absolute level.
Volume conforms with smart accumulation: large-volume selling has ended, replaced by lower-volume, steady buying that the April catalyst should convert into momentum participation.
Volatility Matrix:
The ATR Histogram sits at a configuration of mild expansion after prolonged compression. The ribbon is in the early stage of widening after months of contraction accompanying the post-fire consolidation. Compression-to-expansion transition has not yet fired, confirming that the trade remains in its accumulation phase.
Regime Rotation Radar:
PBF/VLO measures whether the market is favoring the surviving refiner over the departing one; sustained outperformance confirms the thesis. The secondary ratio XLE/XLU (Energy versus Utilities) measures whether the broad market is in a risk-on energy regime or a defensive posture. PBF’s thesis depends on California-specific supply tightness, yet the stock will not rerate if the entire energy sector is being sold in a risk-off rotation. Strength in the energy-versus-utilities relationship confirms that capital is flowing into energy broadly, providing the tide that lifts PBF’s specific position. Weakness in that same relationship while PBF/VLO holds firm suggests the trade is fighting the sector current and should be sized down or deferred.
The RRR shows PBF in early regime transition. Underperformance is decelerating, while outperformance is not yet established. The primary ratio’s negative readings confirm that Valero has historically dominated. Yet the spread is narrowing as PBF’s relative underperformance decelerates, the precursor to the regime inversion the thesis predicts once Benicia closes. The ribbon shows contested territory with neither ticker sustaining momentum, the transitional condition where catalysts rather than trend have predictive value. The firmly positive secondary ratio, XLE/XLU, confirms that the broad energy-versus-utilities regime supports a long position.
The combination is the earliest-stage entry signal in the framework. The sector environment is supportive, yet the specific stock has not yet expressed leadership. The April closure should provide the inflection that shifts the primary ratio from negative to positive territory.
Trade 2: Long California Resources Corp (CRC), the Contrarian Freshwater Bet
Instrument:
California Resources Corporation (CRC), common equity, long directional position accumulated on pullbacks into the weekly moving average support zone.
Thesis:
This is the freshwater species betting that the dams will partially open, and the element of trade construction it foregrounds is contrarian verification: recognizing when a consensus position has been overtaken by facts on the ground.
Shorting CRC would have been catastrophically wrong. The stock trades near its all-time post-restructuring high, with an analyst consensus of “Buy” and an average price target of $61.88. The company produces roughly 90,000 barrels per day of California crude and owns Elk Hills, one of the largest domestic oil fields. CRC completed its acquisition of Berry Corp, adding production and acreage, and its Carbon TerraVault initiative provides optionality on federal sequestration credits. With 2,000 new Kern County permits approved under SB 237 and California’s growing recognition that domestic production is preferable to import dependence, CRC is positioned to benefit from any policy normalization.
Catalysts and Monitoring:
SB 237 permit issuance is the primary catalyst, monitored through CPUC quarterly reports for permit acceleration or reversal. CRC’s Q2 2026 earnings will reveal Berry Corp integration metrics and Elk Hills production guidance. Carbon TerraVault milestones, tracked through DOE sequestration credit announcements, provide a secondary catalyst on federal subsidy confirmation.
Entry / Exit Logic:
Enter on pullbacks to the $48 to $52 range, particularly if oil prices dip toward $55 WTI, a zone that corresponds to accumulated volume support, the weekly 200-period moving average near $48, and the fork’s central median. Accumulate in thirds across that range. The exit target sits at $68 to $72, or on resumption of hostile permitting policy. Take profits at fifty percent of the position if $65 is reached; hold the remainder through the permitting cycle. Close entirely if California reverses SB 237 or imposes new production moratoriums.
Invalidation:
A stop-loss at $43 protects against the scenario in which the dams never open and the freshwater fraction continues to decline. If CRC/XOP fails to hold positive territory on a pullback to the entry zone, the California-specific recovery premium is evaporating; exit the position regardless of price level.
Risk Management:
The risk profile centers on commodity prices: sustained WTI below $50 compresses margins on heavy California crude, and the differential penalty (currently 13% below global benchmarks) could widen further if pipeline infrastructure deteriorates. The raw ATR of roughly 3.2% of the stock price, significantly lower than PBF’s 5.7%, permits tighter percentage-based stops and larger position sizes for the same dollar risk. Cap position size at 1.5 R of portfolio value. Do not initiate this trade simultaneously with Trade 1 at full size; the two share California-specific correlation that compounds drawdowns in an adverse regulatory event.
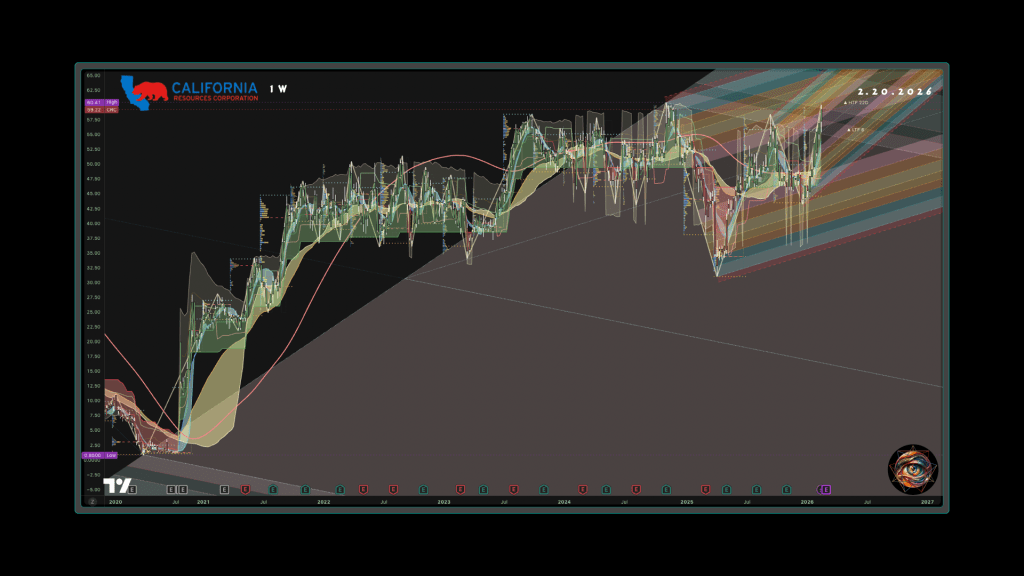
Price Action:
CRC’s entire post-bankruptcy arc is visible on the weekly chart: emergence from Chapter 11 near $0.85 in late 2020, rally to $57 by mid-2022, pullback to $37, rally to $55 in early 2024, crash to $30.97 in early 2025, and recovery to $59.22. The weekly structure is a staircase of higher lows ($0.85, $37, $30.97) with each trough shallower as a percentage decline, confirming long-term structural improvement. The sharp V-recovery from $30.97 occurred on the heaviest weekly volume since the stock’s emergence from bankruptcy, the capitulation signature that typically marks the end of a distribution cycle and the beginning of accumulation.
The daily chart presents a stock in an entirely different structural regime from PBF. CRC trades within 2% of its 52-week high of $60.41, with the SUPeR TReND anchor pinned at the close and the ±2.718 ATR projected limit at $59.50, meaning the stock sits at its statistical exhaustion boundary for the current impulse. The $57.40 projection marks the first pullback target where accumulation becomes attractive. The Triple Differential Moving Average Braid is fully extended in bullish configuration: the Golden Section confirms structural soundness, the Royal Guard indicates strong medium-term institutional positioning, and the Silver Thread has produced a bearish micro-crossover (21-day SMA below 21-day EMA) within an otherwise uniformly bullish braid. This configuration typically precedes a shallow pullback of one to three weeks before the broader trend reasserts itself. FibForks show price testing the upper boundary of an ascending channel near $60 to $61, with the most recent session printing a bearish candle (-0.30%) at that boundary, an exhaustion signature that often precedes retracement to the channel’s midline.
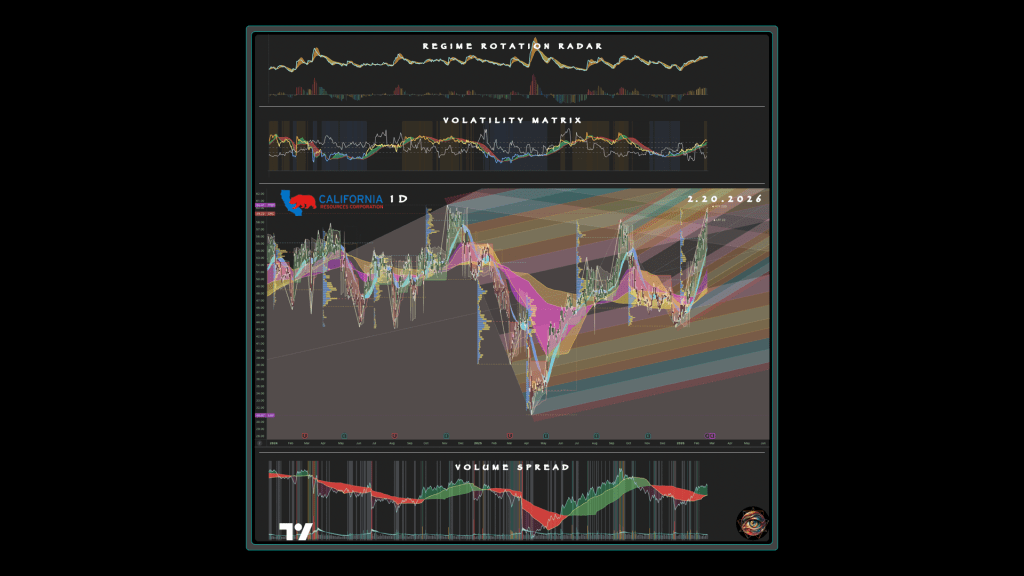
Volume Spread Analysis:
The rally to new highs has occurred on declining volume, a classic bearish divergence between price and participation. Current volume at 740,280 sits below both the 21-period EMA (746,510) and the 34-period EMA (793,920). OBVX readings are negative across all three measures (OBV -43.08 million, Short MA -46.65 million, Long MA -47.09 million), and the Volume Spread has not achieved the clean green dominance visible on PBF’s chart, suggesting that institutional conviction behind the rally is less unanimous than price implies. The PVP data confirms this reading: 15,220 contracts on up-moves versus 16,200 on down-moves, a slight seller advantage at the current level. The volume structure places the weight of evidence against chasing the stock at its high, yet the heavy capitulation volume at $30.97 provides structural support for the thesis that a pullback into the $48 to $52 zone would find institutional buyers willing to re-engage.
Volatility Matrix:
The ATR Histogram reads 0.3131, more than double PBF’s, with the HMA (1.89) slightly above the EMA (1.83) and the ribbon in early expansion mode. Expanding volatility near an all-time high signals that the next significant move will be larger than recent bars, a condition that could serve or sabotage the thesis depending on direction. VoluTility shows a decaying expansion configuration, with the EMA crossing above the HMA in an orange-to-yellow ribbon transition, the mature-trend signature that typically precedes either continuation or retracement. The reading reinforces the recommendation to wait for the pullback rather than chase the current level.
Regime Rotation Radar:
CRC is in a state of California-specific leadership that the secondary ratio challenges. The primary ratio, CRC/XOP, confirms decisive outperformance against the broader E&P sector. The secondary ratio, WTI versus Brent, shows Brent outperforming WTI. This condition compresses California producers’ margins because their crude already trades at a discount to the domestic benchmark. This tension between a bullish primary ratio and a bearish secondary ratio is the kind of regime ambiguity that warrants patience. The market has priced in the California recovery story through the primary ratio, yet the commodity backdrop threatens to erode the margin thesis from underneath. Enter only when the secondary ratio stabilizes or improves.
If the WTI-Brent spread widens further against domestic producers, defer the trade entirely.
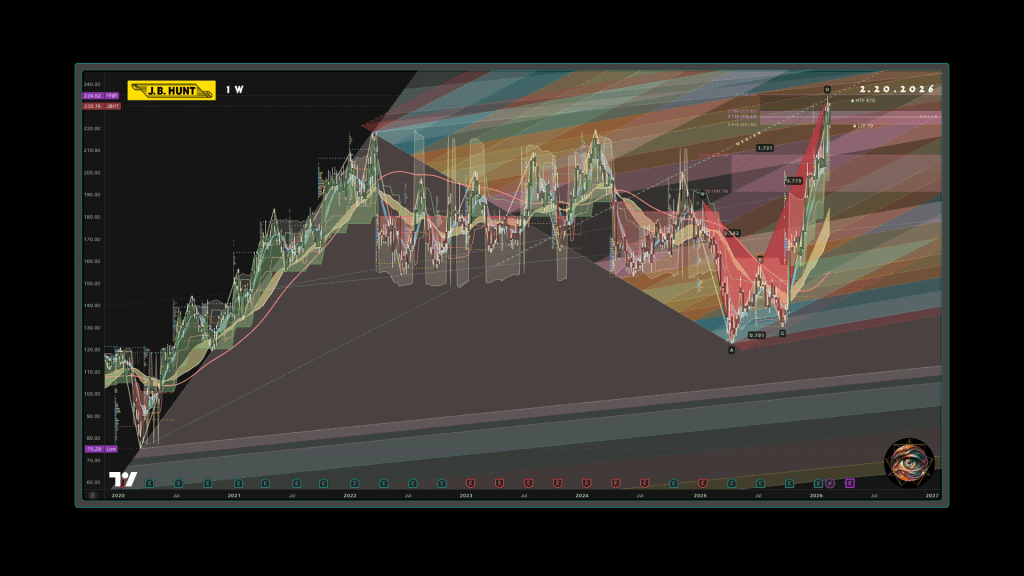
Trade 3: Long J.B. Hunt Transport Services (JBHT), the Saltwater-Tolerant Carrier
Instrument:
J.B. Hunt Transport Services, Inc. (JBHT), common equity, long directional position accumulated on pullbacks to the braid cluster and accumulated volume support.
Thesis:
J.B. Hunt employs company drivers and stopped using independent contractors in California years before AB5 enforcement began, making it one of the few large carriers whose California operations face no reclassification risk. As independent truckers exit and capacity tightens, J.B. Hunt captures market share in drayage, regional hauling, and intermodal transport. The company operates one of the largest rail-truck intermodal networks in North America, a structural advantage if shippers shift long-haul volume to rail to circumvent California’s trucking constraints. This trade rests not on a single event but on a regulatory regime that permanently advantages one class of competitor over another.
In the estuary’s terms, this is the saltwater-tolerant species that thrives precisely because its brackish competitors cannot survive the new conditions.
Catalysts and Monitoring:
Monitor the JBHT/ODFL ratio to test if large integrated carriers are outperforming regional haulers. A regime shift toward JBHT leadership confirms that scale and compliance confer advantage in the AB5 environment. The secondary ratio, the Dow Jones Transportation Average versus the S&P 500, measures whether transportation as a sector is in a leadership or lagging regime relative to the broad market.
JBHT is a transportation bellwether as well as a California-specific play. Transports leading the broad market confirms the macro environment supports the thesis. Transports lagging serves as both a caution signal and an early recession indicator, since the transportation sector tends to roll over before the broad market in cyclical downturns.
- Ongoing: AB5 enforcement escalation (California Labor Commissioner filings and penalty assessments for enforcement intensity).
- Ongoing: FMCSA CDL threat (Federal Register for California CDL rulemaking updates).
- Quarterly: JBHT earnings (intermodal revenue per load and California-specific drayage volume for market-share confirmation).
Entry / Exit Logic:
Entry merits accumulation on dips to the $170 to $185 range, which may coincide with general freight market softness or recession fears that temporarily obscure the California-specific tailwind. Accumulate in thirds. The exit target sits at $220 to $230, or when AB5 enforcement intensity peaks and rate increases are fully reflected in earnings. Take partial profits if the JBHT/ODFL ratio turns positive before price reaches the entry zone, confirming that the structural advantage is expressing itself in relative performance.
Invalidation:
A stop-loss at $160 protects against the scenario in which a prolonged freight recession suppresses volumes and rates broadly, overwhelming the compliance advantage. If JBHT/ODFL remains negative after two consecutive quarters of AB5 enforcement escalation, the structural advantage thesis is not translating into relative performance; exit regardless of absolute price. If the stock has not pulled back to the $185 level within six months, reassess the entry zone relative to the braid’s upward drift.
Risk Management:
The raw ATR of 3.8% of the stock price is moderate for a transportation name. The pending harmonic D-point completion creates elevated reversal probability. Chasing the stock at $230 is a poor risk-reward proposition. Cap position size at 1.5 R. Pair with the Canadian Pacific Kansas City Limited for diversified transportation exposure. They share logistics tailwinds but differ in their specific catalysts (AB5 compliance versus port diversion).
Price Action:
The five-year view shows JBHT’s entire post-pandemic arc: a rally from $75.29 to $210+ in the 2020-2022 freight boom, a grinding decline through 2023 and 2024 as the freight recession compressed rates and volumes, and the dramatic V-recovery beginning in early 2025. The ABCD harmonic pattern is even more visually striking at the weekly resolution, with the A-to-D structure spanning roughly eighteen months and the D point coinciding with a test of the all-time-high zone near $234.82.
Pitchfork geometry shows price approaching a long-term ascending median, confirming that the D-point is a mathematically significant target rather than an arbitrary round number. The SUPeR TReND reflects the sustained duration of the weekly trend, a persistence that signals institutional conviction rather than speculative froth.
The most important feature for the trade thesis is the volume profile visible in the weekly chart’s structure. The dense consolidation between $155 and $190 during mid-to-late 2025 represents the volume-weighted center of gravity for the stock’s current ownership base. A pullback into this zone would bring price into contact with the heaviest accumulated volume of the past twelve months, creating the kind of high-conviction entry that the method identifies: a pullback to a dated catalyst (AB5 enforcement escalation) providing the fundamental rationale for re-engagement.
The daily chart displays one of the most textbook harmonic structures in the current market.
The braid configuration, with price trading dramatically above all three layers, describes a stock that has rallied so far and so fast that the moving averages have not yet caught up. The implication is clear: either the braid layers will accelerate upward to confirm the breakout, or price will correct back toward the braid. The recommended entry range targets the zone where the braid’s gravitational pull would arrest any correction.
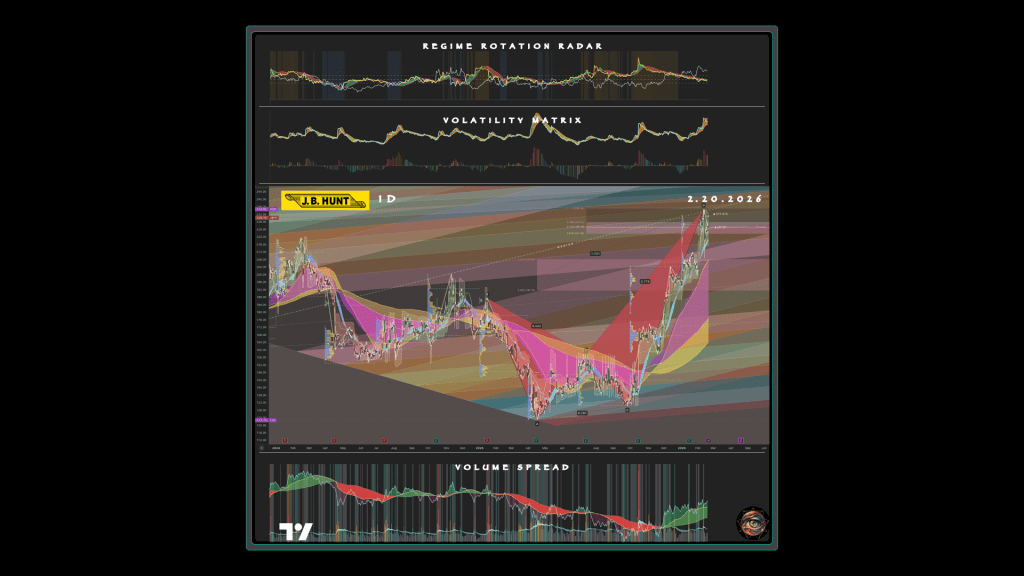
Volume Spread Analysis:
The Volume Spread delivers the most structurally bullish reading of any in the survey. This is the only trade in the survey where On-Balance Volume is unambiguously positive across all three readings. The visual confirmation is dramatic: the technicals chart shows a years-long transition from the distribution that dominated 2024 into a steadily expanding accumulation through 2025 and into early 2026. Current daily volume sits well below the 21- and 34-period EMAs, indicating that the rally has occurred on declining volume. Typically a negative signal, here it signals institutional positioning, not retail enthusiasm.
To reconcile the seeming contradiction of strong OBV trend with declining daily volume, note that the stock has been accumulated steadily over many months at lower price levels, thus the current rally represents price catching up to the volume structure rather than speculative volume chasing price.
Volatility Matrix:
The ATR Histogram is the highest among the six trades, and the ribbon is visibly expanding. At the top of a harmonic ABCD completion, this is a warning. Volatility tends to spike at D-point reversals, and the current expansion suggests that the next move (whether continuation or correction) will be larger than the average recent bar. The ATR’s upward trajectory means that stops placed at structural levels will require wider dollar amounts than they would have during the quieter consolidation phase.
Regime Rotation Radar:
The technicals expose the internal tension beneath the rally’s surface and provides the clearest case for patience among all six trades. The negative primary ratio (JBHT/ODFL) confirms that ODFL has outperformed JBHT over the measurement window, yet the fast MA is converging toward the slow MA from below, signaling an incipient regime shift. The strongly positive secondary ratio (IYT/SPY) confirms that the transportation sector is currently in a leadership regime relative to the broad market. This divergence creates an actionable asymmetry. The sector environment is overwhelmingly favorable, yet the specific stock has not yet asserted leadership against its regional peer.
When the primary ratio crosses from negative to positive, it will confirm that AB5-driven structural advantage is expressing itself in relative performance, and that confirmation is worth waiting for rather than anticipating.
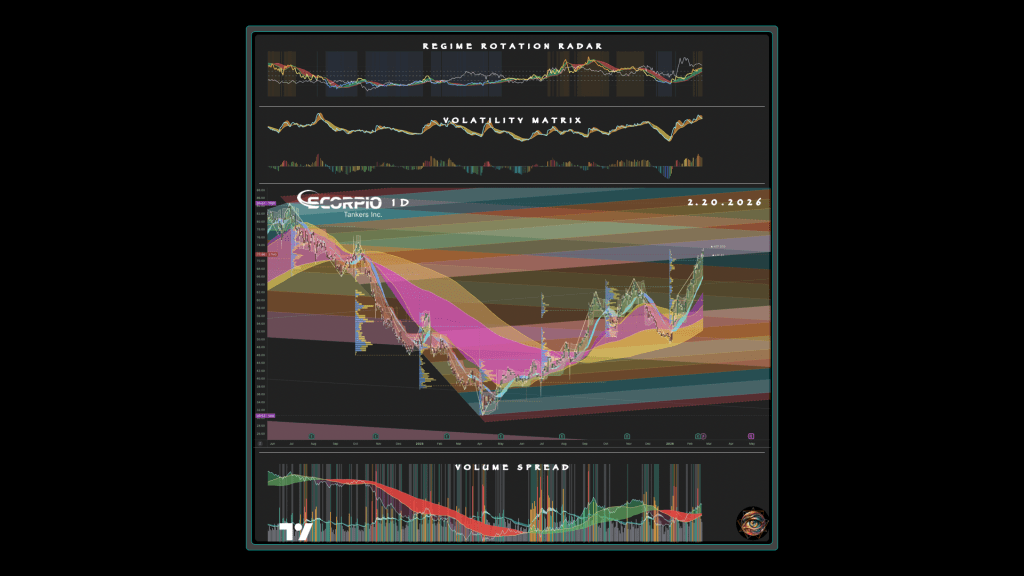
Trade 4: Long Scorpio Tankers (STNG), the Saltwater Delivery System
Instrument:
Scorpio Tankers Inc. (STNG), common equity, long directional position accumulated on rate-related pullbacks into the braid support zone.
Thesis:
With California losing 17% to 20% of its refining capacity and possessing no interstate fuel pipelines, the state must import refined products by sea. The estuary’s freshwater has been dammed; the saltwater must now arrive by tanker. Scorpio Tankers operates one of the world’s largest fleets of MR and LR product tankers, the vessel classes that carry gasoline, diesel, and jet fuel across transoceanic routes. The tightening of California’s domestic supply creates arbitrage opportunities for Asian and Gulf Coast refiners to ship cargoes to the West Coast, and each cargo requires a tanker. Global tanker markets are already constructive from trade-route lengthening caused by Russian sanctions and recovering air travel.
The trade setup that STNG foregrounds is second-order beneficiary logic: the trade profits not from the crisis directly but from the logistical response the crisis necessitates.
Catalysts and Monitoring:
- April 2026: Valero Benicia closure (CPUC decommissioning filings for confirmation).
- Summer 2026: driving season (EIA PADD V gasoline and diesel import volumes for West Coast product tanker demand confirmation).
- Ongoing: global tanker rate indices (Clarksons MR clean product rates for supply-demand tightness).
Entry / Exit Logic:
Entry merits accumulation on any rate-related pullback, with the catalyst being the confluence of Valero Benicia’s April 2026 closure and the summer driving season that follows. Accumulate in thirds. The exit target sits at $80 to $85, corresponding to a retest of the prior all-time high on recovered rate momentum. De-risk fifty percent of the position if $80 is reached; hold the remainder through the summer 2026 driving season.
Invalidation:
A stop-loss set at 20% below entry reflects the stock’s inherent volatility and the binary nature of tanker rate movements. If STNG/EURN fails to hold positive territory during a broad tanker rate pullback, the product-specific thesis is failing; reduce position by half regardless of absolute price. Close entirely if Clarksons MR clean rates fall below seasonal norms for three consecutive weeks.
Risk Management:
The volume structure is consistent with a rally being sold into rather than one attracting fresh capital, which reinforces the entry discipline of waiting for a rate-related pullback rather than chasing the current price. The key risk is a collapse in tanker rates from fleet oversupply or global demand destruction. The PVP data warrants caution: a 3:1 seller advantage that is the most skewed of any trade. This lopsided distribution suggests institutional selling into the rally’s strength, which warrants reduced initial position size (0.75 R rather than the standard 1 R) until the PVP ratio normalizes. Cap total position to 1.5 R including additions. BDRY/SPY confirms that global shipping demand is outperforming the broad equity market by more than two standard deviations. The combination of a strongly positive primary ratio and a strongly positive secondary ratio is the highest-conviction entry signal in the ratio framework. STNG benefits from both the California pull factor and the global shipping tailwind.
The risk is that this double-confirmation at statistical extremes presages mean reversion rather than continuation: enter on the pullback, not the confirmation.
Price Action:
The chart shows a stock midway through a powerful regime transition. STNG bottomed in mid-2025 after losing more than 60% of its value in under twelve months as tanker rate pessimism overwhelmed the fundamental story. The Triple Differential Moving Average Braid is fully and robustly bullish. The Silver Thread, however, shows a mild bearish micro-crossover, where the 21-day SMA has slipped below the 21-day EMA, a short-term caution flag. This micro-signal within a macro-bullish braid is the same pattern observed on CRC, and it typically resolves through a shallow one-to-two-week consolidation before the trend resumes. The pitchforks show price reclaiming the upper half of the overall range, with ascending support lines from the July 2025 low converging with the braid structure.
The volume profiles show heavy accumulation between $55 and $65 from the fall 2025 consolidation, providing a structural floor for any pullback.
Volume Spread Analysis:
The pane tells a story of contested transition. The OBVX readings are mixed. OBV itself is positive, yet both the short and long MAs are negative, indicating that the recent volume-weighted trend has been mildly distribution-oriented. A transition from the distribution of late 2024 and early 2025 into accumulation began forming in mid-2025, and has expanded through the recovery. A lopsided seller advantage suggests institutional distribution into the rally’s strength. This is the single most cautionary data point among all six trades and warrants reduced position size or a wider entry range.
Volatility Matrix:
The ATR Ribbon is expanding, and the raw reading is a moderate and manageable 3.3% of the stock price. Expansion near recent highs is consistent with the other trades that are pressing against ATR exhaustion limits, confirming that the current phase favors patience for new entries while validating the structural thesis for existing positions. The ATR of Volume shows a decaying-expansion configuration characteristic of a mature trend, confirming that the rally is compressing from a prior expansion rather than building toward a new one.
Regime Rotation Radar:
The technicals pane shows STNG in the highest-conviction bullish regime position among all six trade ideas.
The primary ratio to monitor is Scorpio versus Euronav (a crude tanker peer), which distinguishes product tanker momentum from broader shipping sentiment. Product tanker outperformance with accelerating momentum represents the highest-conviction entry condition. The trade thesis argues this extreme is structural rather than cyclical, since California’s import dependency creates permanent demand for product tankers that crude tanker demand does not share.
The secondary ratio, Baltic Dry Index ETF versus the S&P 500, measures global shipping demand relative to the broad equity market. Product tanker rates can diverge from dry bulk rates, yet a broad shipping demand collapse would signal macro demand destruction that eventually reaches product tankers regardless of California-specific tightness. Strength in the global shipping demand relationship confirms that STNG benefits from both the California pull factor and the global shipping tailwind; weakness functions as a macro filter that warrants reduced position size.
The combined reading is exceptional. A primary ratio above 1.5 standard deviations indicates that product tanker outperformance against crude tankers has reached a statistical extreme. Historically, this precedes either continued momentum (if the fundamental driver is structural) or mean reversion (if the driver was temporary). The trade thesis argues for the former, since California’s import dependency is structural rather than cyclical.
Trade 5: Long Chevron (CVX), the Apex Predator Feeding at Every Trophic Level
Instrument:
Chevron Corporation (CVX), common equity, long directional position accumulated on pullbacks to the breakout’s structural origin.
Thesis:
Chevron operates two of California’s nine remaining refineries (El Segundo and Richmond) and produces roughly 125,000 barrels per day of California crude. Vertical integration insulates Chevron from the pricing dislocations afflicting independent producers and independent refiners alike: its upstream losses on widening differentials are offset by downstream gains on tightening crack spreads. In the estuary’s terms, this is the apex predator whose physiology allows it to feed at multiple trophic levels regardless of salinity. As competitors exit, Chevron’s market share of California fuel sales rises without additional investment. The company’s 4% dividend yield provides downside protection, and its global diversification means California-specific risks are a fraction of total enterprise value.
Chevron offers vertical integration as a hedge: the trade demonstrates how an integrated operator can profit from both sides of a dislocation simultaneously.
Catalysts and Monitoring:
The ratio of CVX/XLE tests whether Chevron is outperforming the energy sector broadly. Persistent outperformance confirms that integrated California operators are capturing disproportionate value from the supply dislocation. A secondary ratio, Gold versus long-term Treasuries, measures the safe-haven preference regime.
Chevron’s thesis includes a defensive component, so the trade benefits from an environment where investors seek real-asset safety over bond safety. Gold outperforming bonds signals that inflation fears and real-asset preference are dominant, which supports energy equities broadly and integrated majors specifically. Bonds outperforming gold signals that the market is pricing in deflation or recession, which would suppress oil demand and undermine even Chevron’s integrated resilience.
- January 2026 breakout confirmation: Does price hold above the breakout level?
- April 2026: Watch for downstream crack-spread expansion in Chevron’s West Coast refining segment post Valero Benicia closure.
- Ongoing: Monitor California gas price, as legislative action on margin penalties could cap the thesis.
Entry / Exit Logic:
Entry merits accumulation at $145 to $155 on any oil-price-driven pullback. Accumulate in thirds. The exit target sits at $195 to $200, corresponding to the weekly “Overthrow” projection and the next significant Fibonacci extension target. Consider taking profits at fifty percent if $190 is reached, and holding the remainder through the California refinery rationalization cycle.
Close entirely if the breakout level at $168 fails on a weekly closing basis.
Invalidation:
A stop-loss at $130 protects against the scenario in which a global demand shock overwhelms even Chevron’s integrated resilience. The risk is also political: California has created a Gas Price Monitor and could impose margin penalties on surviving refiners, a regulatory predator that even the apex species cannot ignore. If price makes a new high while bearish momentum divergence persists, reduce position by one third and raise the stop.
If CVX/XLE remains deeply negative after two quarters of California refinery closures, the market is not rewarding the integrated advantage; exit regardless of price.
Risk Management:
The raw ATR translates to roughly 1.9% of the stock price, the lowest percentage volatility among the six trades, permitting the widest absolute-dollar stops with the smallest portfolio impact. This makes CVX the most forgiving position-sizing environment in the survey and the natural core holding around which the other five trades orbit. Cap position size at 2 R. The political risk is real: California could impose margin penalties on surviving refiners, a regulatory predator that even the apex species cannot ignore.
Pair with the long PBF Energy trade for concentrated California refining exposure, or hold CVX alone as the lower-volatility expression of the same thesis.
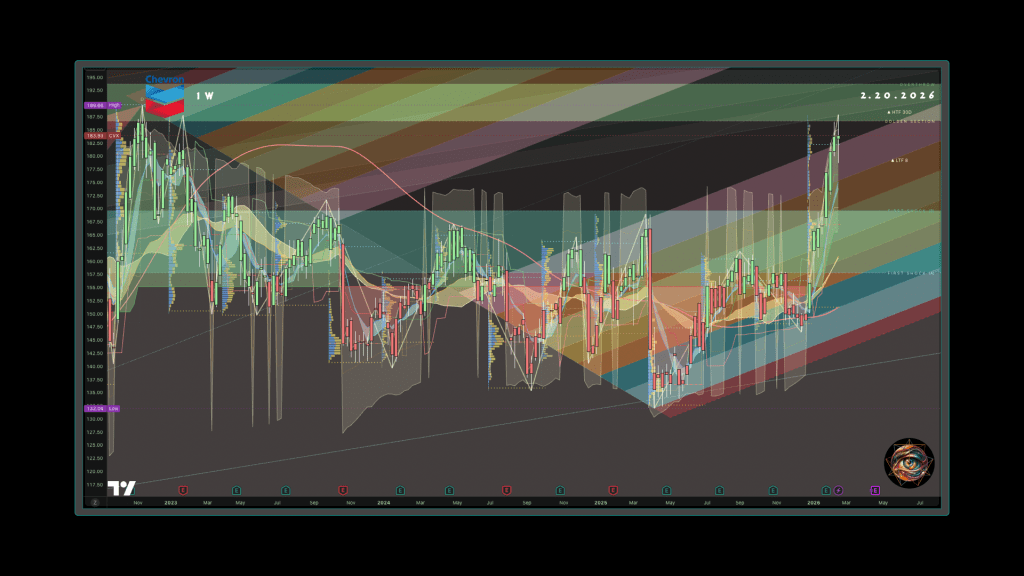
Price Action:
The weekly chart provides the multi-year context that frames the daily breakout as a structural event rather than a speculative spike. The breakout in January 2026 carried price above the prior all-time high for the first time in more than three years, which is the defining characteristic of a structural regime change rather than a cyclical rally. The most analytically significant feature on the weekly chart is the FibForks structure. The labels on the right edge suggest projected future support and resistance levels. A weekly pullback to this zone would represent a retest of the breakout level, the highest-probability entry setup in classical technical analysis, occurring at a confluence of the weekly support, the breakout origin, and the Fibonacci extension structure.
The daily chart shows a stock that has broken decisively out of a fourteen-month consolidation range. From the beginning of 2025 through late January 2026, Chevron traded in a broad channel between $132 and $168, with the braid layers compressing into a tight cluster that reflected the market’s indecision regarding integrated energy’s forward value. The breakout arrived in late January 2026 as a vertical thrust in fewer than four weeks, a move of over 20%. The current close sits just below the all-time high, with the SUPeR TReND indicating perfect alignment and sustained trend duration.
Volume Spread Analysis:
The spread shows clean accumulation. OBVX registers all three measures positive and rising. This is the second trade (after JBHT) with uniformly positive OBV readings. The chart visually confirms a steady accumulation that has dominated since mid-2025, only briefly interrupted during the October 2025 pullback. Current daily volume indicates slightly below-average participation on the session, consistent with a brief consolidation day within an intact uptrend rather than a distribution signal.
Volatility Matrix:
The Volatility Matrix shows the second-highest reading of the ATR Histogram among the six trades after JBHT. The massive spike corresponds to the January 2026 breakout, where ATR surged from a compressed base to a multi-year high, producing the kind of expansion event that the ribbon is designed to detect. The raw ATR translates to roughly 1.9% of the stock price, the lowest percentage ATR among all six trades, reflects Chevron’s mega-cap stability. This low percentage volatility permits the widest absolute-dollar stops with the smallest portfolio impact, making CVX the most forgiving position-sizing environment in the survey.
Regime Rotation Radar:
The technicals reveal a stock in one of the most powerful trends in the survey, yet with a warning signal that demands attention. Chevron has underperformed the XLE energy ETF over the measurement window despite its recent breakout. The energy sector has rallied broadly, and CVX’s relative performance against the sector benchmark has lagged even as its absolute price surged.
The deeply negative readings of the RRR’s primary ratio are counterintuitive for a stock at all-time highs, but this is not a bearish signal. The sector tide has been rising faster than the largest boat, a condition that often reverses as capital rotates from smaller, higher-beta energy names into the integrated majors. When capital rotates from sector beta into sector quality, CVX/XLE should compress toward zero and eventually turn positive, providing a second leg of returns beyond the absolute price appreciation.
The secondary ratio, GLD/TLT, confirms that real-asset preference and inflation fears dominate the safe-haven landscape, a regime that supports energy equities and integrated majors specifically. Gold outperforming bonds by 1.6 standard deviations is the macro condition where Chevron’s defensive characteristics, including dividend yield, balance sheet, and global diversification, attract capital from investors seeking real-asset safety without commodity-cycle volatility. The regime supports energy equities and integrated majors specifically.
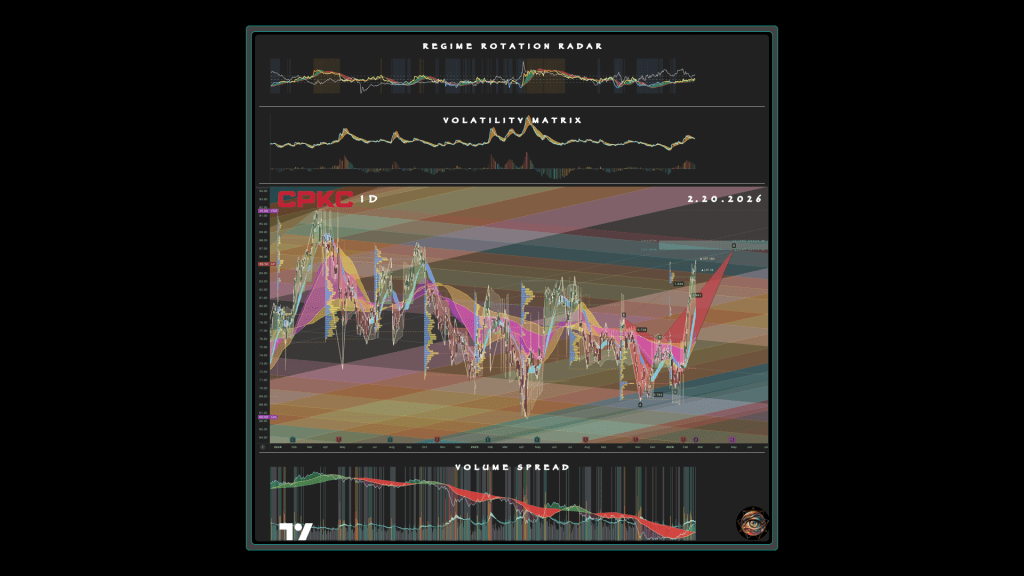
Trade 6: Long Canadian Pacific Kansas City (CP), the New Migration Corridor
Instrument:
Canadian Pacific Kansas City Limited (CP), common equity, long directional position accumulated on pullbacks to the braid cluster and harmonic structural support.
Thesis: CPKC is the only railroad connecting Canada, the United States, and Mexico, making it the primary beneficiary of cargo diversion away from California ports. In the estuary’s terms, this is the migration corridor that gains traffic as organisms flee the collapsing habitat for healthier waters. As AB5 and CDL uncertainty drive importers to reroute containers through Lázaro Cárdenas, Houston, and Gulf Coast gateways, CPKC’s intermodal volumes on its southern corridors grow. The company also transports energy commodities cross-border, positioning it to benefit from increased Canadian crude or refined product flows into the U.S. West.
The element of trade construction that CP foregrounds is network re-routing: the trade captures value from the permanent redirection of physical flows that the crisis accelerates.
Catalysts and Monitoring:
The primary ratio, CP/UNP, tests whether CPKC is outperforming Union Pacific. a railroad with greater West Coast exposure. CPKC leadership would confirm that the market is pricing in re-routing momentum rather than general rail sector strength. The secondary ratio, the Mexico ETF versus the Japan ETF, functions as a near-shoring proxy for capital and trade flows toward Mexico relative to Asia. CPKC’s thesis depends on cargo rerouting through Mexican ports and the near-shoring trend that AB5 and CDL uncertainty accelerate. Mexico outperforming Japan signals that the market is pricing in Mexican logistics growth, which directly supports CPKC’s southern corridor volumes. Asian supply chains reasserting dominance would redirect containers back toward West Coast ports and undermine the re-routing thesis.
This unconventional ratio pairing is more informative precisely because fewer market participants are watching it.
- Ongoing: West Coast port-share data (monitor USDOT container statistics for continued erosion below 30.5%).
- Ongoing: Lázaro Cárdenas volume (monitor Mexican port authority monthly throughput for intermodal growth confirmation).
- Quarterly: CP earnings (monitor southern corridor intermodal revenue per unit and cross-border energy commodity volumes).
Entry / Exit Logic:
Accumulate in thirds. The stock’s current price trades at the D-point of a harmonic pattern, making the current level a statistically overextended entry. Entry merits accumulation on pullbacks to the $72 to $80 range, with the catalyst being continued West Coast port-share erosion and near-shoring momentum. The exit target sits at $95 to $100, or when West Coast port-share data stabilizes, signaling that the re-routing thesis has been fully priced.
Invalidation:
A stop-loss at $68 protects against the scenario in which California resolves its trucking and labor disputes and port diversion reverses, though structural shipping-line decisions are difficult to unwind once container alliances have rewritten their schedules. If CP/UNP fails to cross from negative to positive within twelve months, the re-routing thesis is not translating into relative performance. If port-share erosion reverses for two consecutive quarters, exit regardless of absolute price.
Risk Management:
The technicals pane distinguishes CP from the other five trades in several important dimensions. The raw ATR translates to roughly 2.0% of the stock price, which is moderate and manageable. The seller skew and the Volume Spread suggest that the accumulation cycle is less mature for CP than for the energy names. The entry discipline is to wait for either the pullback to the $72 to $80 zone or the primary ratio crossover, whichever arrives first, and to size conservatively until both conditions are satisfied. Pair with Trade 3 (JBHT) for diversified transportation exposure across complementary catalysts.
Price Action:
The daily chart reveals an ABCD harmonic pattern that mirrors JBHT’s structure with compressed proportions. The A point sits near the 52-week low from mid-2025, with the B-to-C retracement completing and the D-point extension reaching the current zone. The measurements confirm that the structure is reaching its completion zone, where the ratios predict either continuation through the target or a reversal back toward the C-point retracement level. The SUPeR TReND trail provides dynamic support below the current close, confirming that CP has broken through its statistical exhaustion boundary and is trading in extended territory. The Moving Average Braid presents a transitional configuration. The Golden Section is in a marginal death cross, the Royal Guard is narrowly bullish, and the Silver Thread is bearish. This mixed braid, where one layer is marginally bearish, one is marginally bullish, and the fastest is bearish, describes a stock in the early phase of a regime transition.
Price has rallied above the braid cluster with enough force to suggest that the transition will resolve bullish, yet the confirmation is not yet complete.
Volume Spread Analysis:
The Volume Spread pane tells a story that diverges sharply from the other five trades and demands careful interpretation. The chart shows distribution through nearly the entire visible window, from early 2024 through late 2025, with only a recent and tentative emergence of accumulation. OBVX is positive, yet the visual dominance of the red cloud suggests that the long-term ownership structure has been distribution-oriented and is only now beginning to shift. Current daily volume at 3.15M slightly exceeds both the 21-period EMA (2.95M) and 34-period EMA (2.82M), indicating above-average participation on a positive session, a constructive signal at the micro level. The PVP shows a seller advantage that remains significant but is less extreme than STNG’s 3:1 skew.
The volume is consistent with a stock in the early phase of accumulation, where smart money is building positions into residual selling pressure from the prior distribution phase.
Volatility Matrix:
The Volatility Matrix shows an inflection point between compression and expansion. The ribbon is neither expanding nor contracting; it is coiled. The raw ATR translates to roughly 2.0% of the stock price, moderate and manageable. This means that the next volatility move, whether expansion or contraction, will be directionally informative. An expansion in ATR coinciding with a breakout above the Fibonacci target would confirm momentum; a contraction during a pullback would suggest healthy consolidation rather than distribution.
Regime Rotation Radar:
The RRR shows CP in the most nascent regime shift of any trade. The primary ratio is nearly at the zero line, meaning CPKC and Union Pacific are performing almost identically at this moment. The critical signal is the trajectory: the divergence between fast and slow MAs indicates that CPKC’s relative performance against Union Pacific is improving rapidly, and a crossover of the fast MA above zero would confirm the regime shift. The comparative ratio, the Mexico ETF versus the Japan ETF, is solidly positive. Mexico outperforming Japan by 1.4 standard deviations signals that capital is flowing toward Mexican logistics infrastructure, confirming that the near-shoring proxy supports the cargo re-routing thesis.
The incipient primary ratio crossover combined with a confirmed secondary ratio is the earliest-stage entry signal among the six trades, the point where the thesis is structurally supported but not yet reflected in the relative price performance.
The Regime Shift That Resists Reversal
What Ecology Teaches That Economics Prefers to Ignore
Regime shifts in estuaries are well-documented ecological phenomena. Once the freshwater fraction drops below a critical threshold, the brackish species collapse, the saltwater species colonize, and the system stabilizes in a new state that actively resists reversion. The new inhabitants alter the substrate, consume the resources that the old inhabitants needed, and establish feedback loops that reinforce the new salinity.
The old ecology does not return simply because someone opens a dam. It requires a sustained, overwhelming inflow of freshwater that exceeds the system’s capacity to absorb it gradually, a shock rather than a policy adjustment. Consider the feedback loop in California’s infrastructure:
- Refineries close because regulatory costs exceed margins
- Pipeline volumes drop because fewer refineries purchase local crude
- Pipelines close because volumes fall below economic minimums
- Producers lose access to markets because pipelines close
- Producers reduce output or leave the state
- Reduced output further starves any surviving pipelines
Trucking absorbs the displaced volume at higher cost and lower efficiency, yet AB5 drives truckers out, and FMCSA threatens to invalidate the credentials of those who remain. Each node in the network depends on the others, and the failure of any accelerates the failure of its neighbors. This is not a mechanical breakdown where a part can be replaced, but an ecological reorganization of the habitat itself, an industry where success rates on exploration wells run at 10%, yet operators keep drilling because they are optimists.


Leave a comment