
Have you ever bought or sold stocks or cryptos based on market sentiment? Fear not, for this is no survey; I honestly could not care less what you buy, or why. If I did, as you will see, then there could be no more crude method of learning anything useful.
Since I already keep a finger on the pulse of global capital flow via Tradingview, sentiment occurs to me as an afterthought, despite being its Prime Mover. There are a few key problems with sentiment analysis as the backbone of a trading strategy. Surely the greatest among these are Subjectivity and Delay.
As a tool in behavioral finance and econometrics, sentiment analysis employs a range of sophisticated methods tailored to specific research objectives and data availability. En masse they inform of their underlying principles, mechanisms and applications in divining market sentiment. In this first of a three part investigation, the evolution of sentiment analysis as a crystal ball for predicting market dynamics is met with a healthy degree of skepticism, although its other uses are admitted.
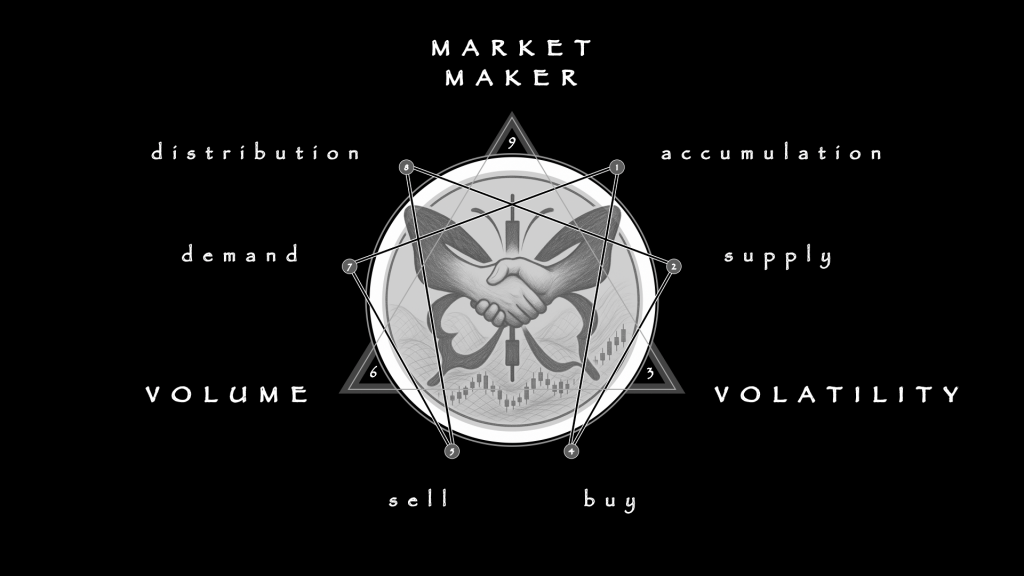
Without further fuss, most large market moves are predicated by the Bandwagon Effect, which is to say that all what we ever “see” is the Dumb Money. The Smart Money is effectively invisible, at least to retail eyes, and requires organs sensitive to VOLUME, VOLATILITY and TREND EXHAUSTION. Fortunately, those three are more reliably lured into the light of measurement than real-time order flow.
In other words, rather than sympathize with the majority, who are always late to the party, I strive to align with the Market Maker.
Of course I did not arrive at that idea early. Worse, my trading career began with crypto after the Covid Crash of March 2020, which is to say that it was a time when the fundamentals exploded and sentiment was “divided”, to put it mildly. There has probably never been a worse time in human history to learn to read price charts and dabble in swing trading.
Nowadays I perform a spontaneous ad hoc sentiment analysis by simply scanning the thumbnails in social media without actually clicking any of the bait … laser eyes tell a lot, most of it misleading. As it turns out, I am practicing what specialists call Principal Component Analysis (PCA), the blended smoothies at the data analytics bar. In the hands of a pro, such clever concoctions are supposed to coax the spirit of the market’s mood swings, giving traders the buzz they need to make those big bets.
Your mileage may vary …
Composite sentiment indices amalgamate various metrics into a single supposedly “robust” indicator to reduce dimensionality and extract key features from the data. The idea is to sharpen the tool by integrating diverse measures, thereby constructing an index that selects sentiment-related variables and validates its predictive power and relevance to market conditions.
The typical finished product, the retail eye-candy that every Noob sees, is some version of the Fear and Greed Index, originally created by CNN.

Now that I have developed my own trading Edge, my informed opinion is that it is deliberately designed to part the Dumb from their Money. To my eye, at least, the scale is presented backwards — with Fear at 0 in red and Greed at 100 in green — more as if to induce sentiment than to gauge it.
For exactly that reason, I and other experienced traders tend to avoid those colors in price charts altogether, at least for the candlesticks. Mine, in fact, are coded not to show price action as “bullish” and “bearish” (which are not strictly defined anyway) merely by rising and falling, but instead to show cycles of Accumulation and Distribution, in yellow and blue respectively.
With all the throat-clearing done, the recipe for the Secret Sauce now follows, with its three ingredients and six steps.
Surveys and Questionnaires
As I mentioned, surveys are a vintage method, very old school, but a charming fine wine for the right occasion. It has a recipe of its own, of course, which is beyond my present scope. The process is bit more complex than straight up asking people, “How do you feel about the market today,” but not much.
Then, with a pinch of psychometrics and a dash of factor analysis, these sentiments are distilled into a potent brew that ostensibly can predict market waves — though beware, it might sometimes taste a bit off due to stale data! Because a greater hazard arises from relying on unqualified opinions, this method is best reserved for where the stakes are lowest.

There are a few key technical challenges of effective survey writing itself. Overcoming them will not only make you a better data harvester, but a better analyst, too.
The first hurdle involves accurately capturing a diverse range of opinions without bias. Getting a representative sample size can be problematic, especially if quality matters. The greatest challenge is to manage the temporal gap between the expression of some sentiment and its subsequent analysis.
Good data has a shelf life. Ironically, the best thing about spoiled data is the shitty smell, because otherwise you might consume it. Even bad data has its uses, as we will see.
Lexicon-Based
Imagine designing a trading strategy (or a marketing campaign, for that matter, or one for political office) on the more solid foundation (… NOT!) of emojis!
Following the taster flight of bland surveys comes the hipster of sentiment analysis, as the lexicon aims to assign a score to a variety of predefined sentiments with its own private handy-dandy dictionary.
Techniques such as the VADER (Valence Aware Dictionary and sEntiment Reasoner) algorithm blend quantitative and qualitative methods to dynamically score words. It can adjust for grammatical rules and syntactical context like sentence structure, of course, and even basic word modifiers.
While highly interpretable, the algorithm is confounded by context and flat out fails with polysemy, which is a fancy way to say that VADER is helpless in the face of puns or double-entendre.
Machine Learning
If the lexicon is not a Sith Lord but a glorified protocol droid, like C-3PO, then the next level of functional sophistication would be R2D2, or machine learning.
Like the bouncers at the club, deciding which emotions pass through the velvet rope into the prediction models, from the quaint Naive Bayes to the swanky deep learning architectures like Long Short-Term Memory (LSTM) networks, these are the droids you’re looking for to spot more subtle mood swings in financial narratives.
Additionally, feature extraction techniques like bag-of-words and TF-IDF (Term Frequency-Inverse Document Frequency) are used to convert raw text into structured formats that these droids can process, with LSTMs and CNNs (Convolutional Neural Networks) focusing on capturing sequential and spatial dependencies in the data.
Now that I have developed my own trading Edge, my informed opinion is that it is deliberately designed to part the Dumb from their Money. To my eye, at least, the scale is presented backwards — with Fear at 0 in red and Greed at 100 in green — more as if to induce sentiment than to gauge it.
For exactly that reason, I and other experienced traders tend to avoid those colors in price charts altogether, at least for the candlesticks. Mine, in fact, are coded not to show price action as “bullish” and “bearish” (which are not strictly defined anyway) merely by rising and falling, but instead to show cycles of Accumulation and Distribution, in yellow and blue respectively.
With all the throat-clearing done, the recipe for the Secret Sauce now follows, with its three ingredients and six steps.
Surveys and Questionnaires
As I mentioned, surveys are a vintage method, very old school, but a charming fine wine for the right occasion. It has a recipe of its own, of course, which is beyond my present scope. The process is bit more complex than straight up asking people, “How do you feel about the market today,” but not much.
Then, with a pinch of psychometrics and a dash of factor analysis, these sentiments are distilled into a potent brew that ostensibly can predict market waves — though beware, it might sometimes taste a bit off due to stale data! Because a greater hazard arises from relying on unqualified opinions, this method is best reserved for where the stakes are lowest.
Where machine learning was the R2D2 of the pack, the HAL-9000s of this Space Odyssey are the Deep Learning Models. BERT (Bidirectional Encoder Representations from Transformers) and his cousin FinBERT, a financial sector-specific adaptation, are savvy enough to select the not-so-secret cues buried in technical reports. No nuance is too minor, no inference too intricate.
These Market Moriartys leverage transformer architectures that prioritize pure context.
Pretrained on extensive text corpora and fine-tuned for specific applications including sentiment analysis, BERT and FinBERT are built to interpret complex language and contextual subtleties in investor communications as well as quantitative data, enabling them to analyze intricate financial documents. The chances are fairly good that if you subscribe to a uniform daily report such as Newsquawk or Bloomberg, then you are already reading FinBERT output, possibly unbeknownst.

Natural Language Processing
We are fully through the Looking Glass now, where everything just might be a simulation after all. Next-generation Natural Language Processing (NLP) creations can quickly crunch numbers and even passably parse speech to rapidly extract even the emotional undercurrents from rivers of text. One of the musical price action forecasts on my YouTube channel features a humorous example of the process … for mature audiences.
This slide reproduces the thumbnail, and also functions as a link. Please watch it and leave critical feedback.
“Ex Machina” is a fine fictional example, albeit a bit hyperbolic, of an algorithm that can turn the raw data in financial news, social media, and corporate disclosures into market insights as smoothly as turning grapes into wine … or truth into bullshit, choose your own adventure. Sentiment is then “extruded” through approaches ranging from simple frequency counts of sentiment-indicative words to more complex syntactic constructions that consider negations and modifiers, further enhancing the depth of the analysis.
Statistical Methods
Nothing can be more sophisticated than NLP, making mere statistical methods (even advanced specimens) seem perhaps a bit anti-climatic by contrast. The essential difference, however, is qualitative, in that they require no 21st century technology and their results are transparent and reproducible, at least in theory.
The statistical methods of sentiment analysis vis-a-vis price action and volatility forecasting rely heavily on Regression Analysis, particularly Vector Autoregression (VAR) and Error Correction Models (ECMs), to predict how sentiment will influence market outcomes. Regression models manage the dynamic relationships between time series data, such as sentiment scores and stock prices, and can reveal causality and the lag effects of sentiment on market movements.
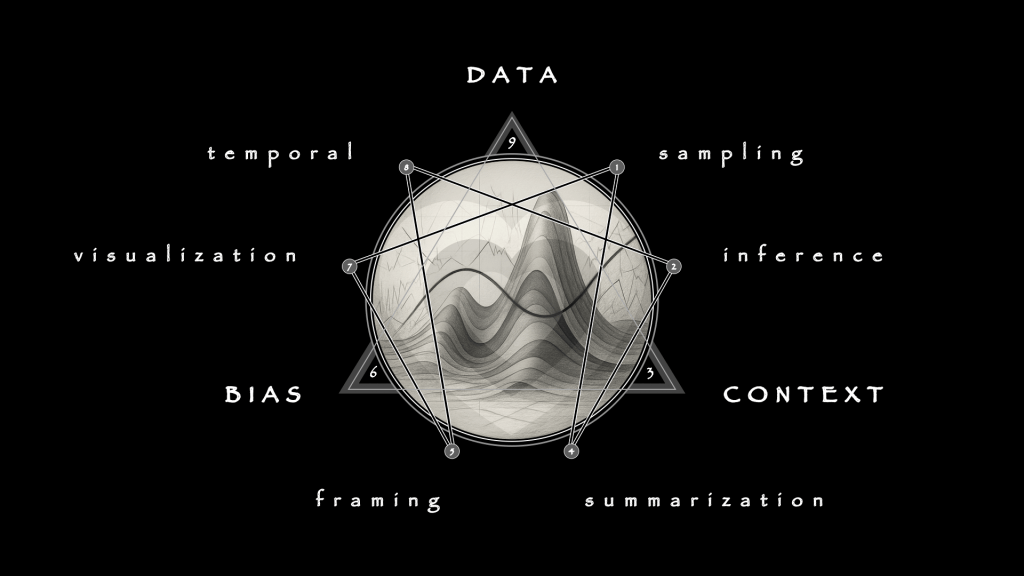
There it is … full spectrum sentiment analysis, encapsulated within a simple enneagram!
Statistically, it is no accident that I rely more heavily on the enneagram for discretionary data analysis than I do on anything containing a microchip. Having proven itself in both psychometric and mechanical domains, its experimental use in behavioral finance pattern recognition is so far bearing juicy fruit indeed, especially in one key competency, being correlative analysis.

Browse my growing body of uniquely original work on the enneagram if you are curious.
Of course, there are other methods, which are more properly hybrids and/or tangents. Notably, VOLATILITY modeling (subscribe for more content on this obscure discipline) and Granger causality tests quantify relationships and assess the predictive power of sentiment indicators on financial variables, supposedly validating the effectiveness and reliability of sentiment measures. Again, though, these may be considered PCAs (Principal Component Analysis), which brings us full circle.
With that, it is time to close this out, however the next installments will continue this line of inquiry, with increasing focus on technical trading. First, in part two, I will demonstrate how the enneagram can guide the construction of better surveys, and unravel how CNN’s well-known Fear & Greed Index is made. Finally, in part three, I will survey and evaluate some of the available technical indicators on Tradingview that visually display Fear & Greed on live price charts.
Anyways, speaking of statistical methods, since predicability bores me, in lieu of a summary I will close out with an amusing and relevant sidebar.
“How to Lie with Statistics”, by Darrell Huff, serves as a timeless reminder that numbers, while seemingly objective, are as malleable as Play-Doh in the hands of those with an agenda. Published in 1954, it’s a must-read for anyone looking to sharpen their critical-thinking skills against the spin doctors of statistics.
Far from a dull academic text, it’s more of a sprightly guide through the murky swamp of statistical manipulation, spruced up with breezy illustrations and enough dry wit to leave you with a satisfied smirk. Huff, a journalist rather than a mathematician, was the ideal rogue to unveil how statistics become twisted. His book explores various tricks of the trade, such as confusing correlation with causation — i.e. blaming roosters for the sunrise — or using creative graphics to exaggerate minor differences to absurd proportions.
It was the go-to staple in my college days, perhaps because it teaches skepticism, a critical skill when wading through the modern data deluge. The switch from Irving Geis’ original illustrations to Mel Calman’s cartoons in the UK edition adds a layer of intrigue, suggestive of a shift in how statistics’ deceptive powers were viewed from one side of the pond to the other — less formal, more accessible, and pointedly humorous. Today, the book’s living lessons are more relevant than ever, proof that while figures never lie, liars often figure.
