
A six-week trial just moved a depression scale further than a stock chart moved in a single session, and only one of those numbers needed FDA approval to matter. Weeks before either number existed, a handful of patient, repeated touches against the same two price levels were already building toward something nobody watching could yet name. Learning to read that kind of contact, rather than the headline candle it eventually produces, separates catching a setup from admiring one after it has already gone. A single, carefully measured dose just outperformed a month of conventional treatment for people who have been failed by it for years. The same molecule that once defined a counterculture now carries a clinical scale, a regulatory designation, and a result precise enough to change how a disease gets treated. Good news, it turns out, still arrives on schedule, even now, for anyone who already knows what to watch.
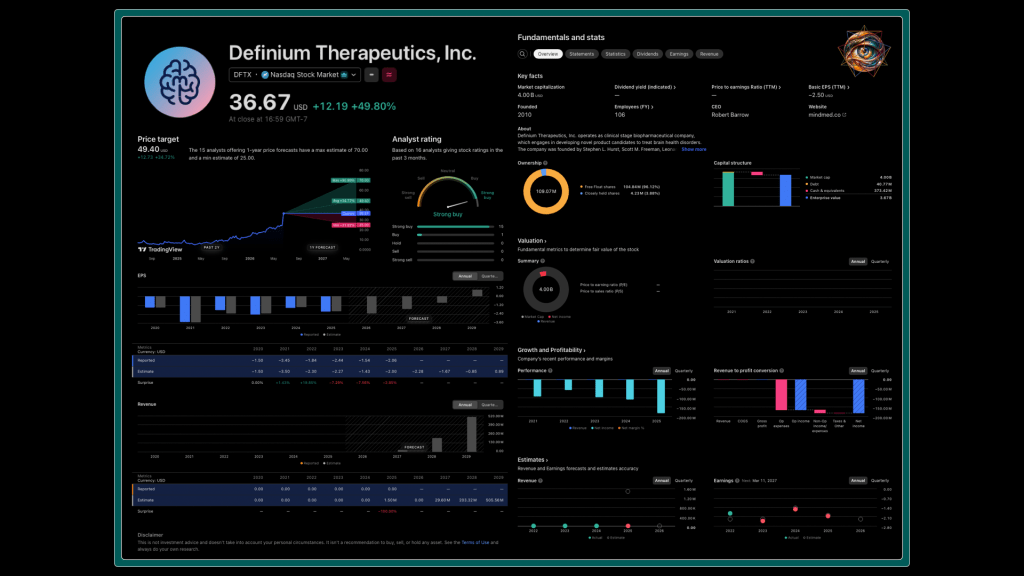
Definium Therapeutics (formerly MindMed) began the Summer of 2026 up 49.8 percent in one day, the kind of performance that might make a chartist sit up straight, or a compliance officer reach for the phone. The occasion was a positive Phase 3 readout for DT120, an orally disintegrating tablet built from lysergide, the same molecule generations of dorm-room mythology know by its other name, now arriving in a single, carefully measured dose, in a clinic, under supervision, with a depression scale instead of a Phish setlist waiting on the other side. The stock, considerably less supervised, had clearly been somewhere before the news broke. The price chart beneath this move had been flatlining as months bled into years, not unlike how real-world depression claims its victims, who slowly fade out into obscurity and are forgotten.
A recent clinical trial produced a number precise enough to change how psychiatry treats depression, and a same-day securities filing produced a number precise enough to change how many shares each existing holder actually owns. Both numbers are true at once, and neither cancels the other out.
Homepage
Perplexity Finance Page
TradingView
A Candle That Cleared Its Own Range In One Breath
Start with the number, since it does real work before any geometry gets to comment on it. A 49.8 percent jump in a single session is the kind of move usually reserved for a meme stock or a short squeeze, not a clinical-stage biotech with an actual dataset behind it … and this one earned its gap honestly. Analyst desks reacted accordingly. Canaccord Genuity raised its target to sixty dollars from thirty-eight, RBC moved to fifty-seven from thirty-six, and the broader coverage pool now stands at fifteen Strong Buys against one lonely, ordinary Buy. The consensus is so one-sided that it feels like a boardroom where everyone already agreed before the meeting started.
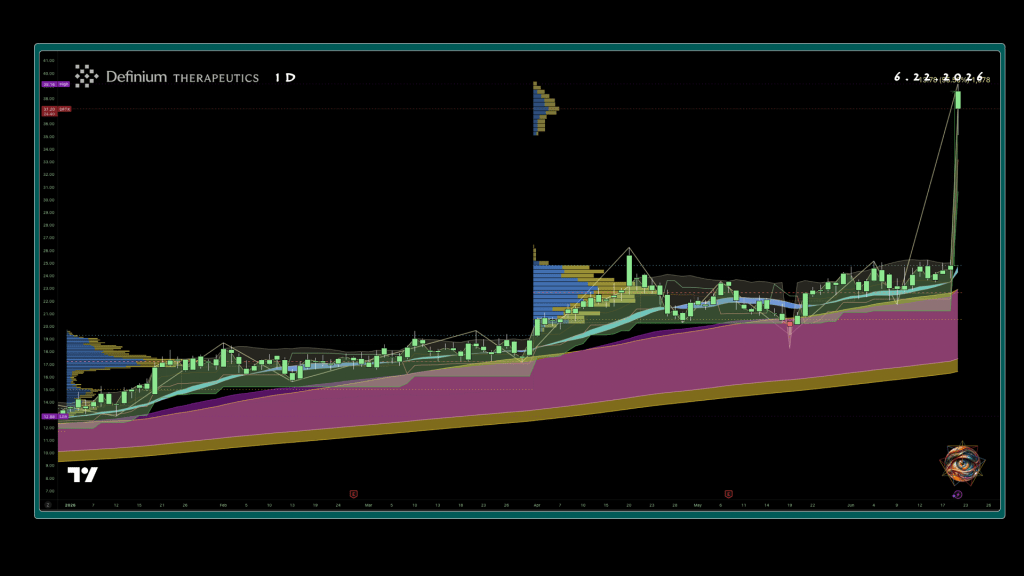
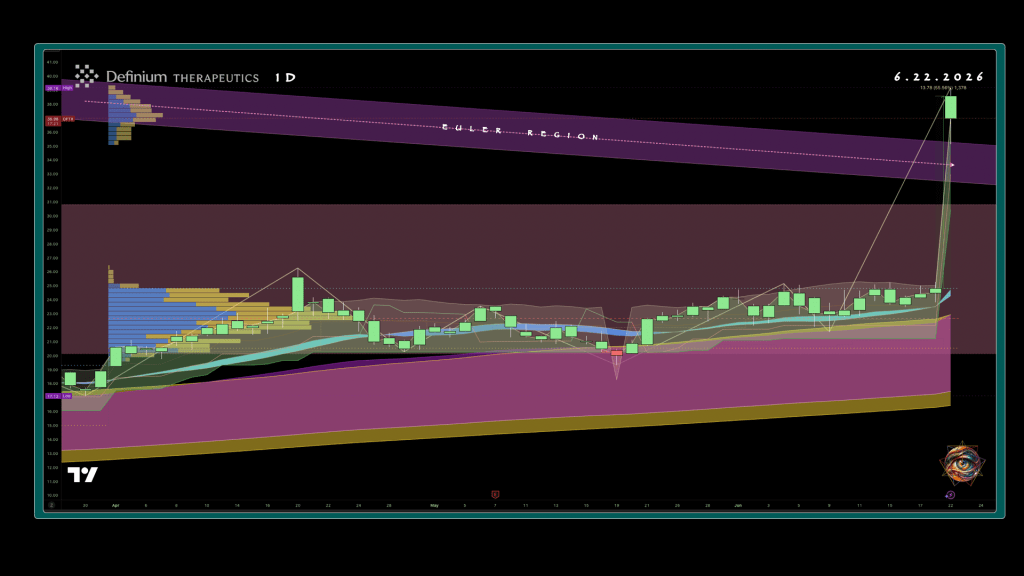
A move this size does not arrive from a calm sea. This stock had spent April through June humming the same four bars over and over, grinding against the upper edge of its own recent range, retreating, then coming back for another pass, the way a jam band circles the same riff for ten minutes before anyone in the crowd notices the actual song already started. Whoever was buying into that grind clearly knew something the rest of the tape didn’t, and Monday supplied the reason after the fact rather than before it.
That sideways churn was not random noise, but an informed minority quietly accumulating conviction long before the headline gave it permission to become a gap.
What Thirteen Points On A Depression Scale Actually Buys
The Montgomery-Åsberg Depression Rating Scale is not a vibe check, but a structured, ten-item clinical interview. Each item is scored zero to six by a trained rater, summing to a total between zero and sixty. Scores from zero to six are read as minimal symptoms, seven to nineteen as mild, twenty to thirty-four as moderate, and thirty-five and above as severe. A trial of this kind enrolls participants sitting in the moderate-to-severe range.
The number that matters is how far that scale actually moved for the people who took the drug, not how far a stock ticker moved for the people who didn’t.
DT120 moved it 13.3 points against 5.2 points for placebo, an 8.1-point placebo-adjusted gap that Needham’s Ami Fadia called unprecedented for the category. Set against a typical moderate-to-severe starting point, a swing of that size plausibly carries a meaningful share of participants down a full severity band, from moderate toward mild or better. The relief showed up inside the first week and held through twelve, a detail that matters as much as the size of the number itself, since a slow, fragile response and a fast, durable one are clinically different outcomes even when the six-week endpoint reads identically on paper.
The comparison Fadia drew sharpens the claim further. The week-six effect size beat what Johnson & Johnson’s Spravato and Compass Pathways’ COMP360 achieved by week four, measured against the conventional benchmarks of Spravato, Axsome’s Auvelity, and Sage’s Zurzuvae that sell-side analysts are now using directly rather than charitably. Outperforming the existing standard of care at an earlier checkpoint, from a single dose rather than a maintained regimen, is the kind of result a field spends a decade hoping to see.
A patient who has already failed two or three prior antidepressants does not experience a placebo-adjusted percentage. They experience a Tuesday that feels different from the Tuesday before it, and this dataset is the first real evidence that DT120 can deliver that difference reliably enough to measure.
A Five Hundred Million Dollar Asterisk Showed Up Before The Confetti Settled
Good news in biotech tends to travel with a chaser. Definium served this one same-day: a $500 million public offering of shares and pre-funded warrants, with underwriters holding a 30-day option for another $75 million, landed within hours of the trial result, and after-hours trading promptly clipped roughly 5 percent off a stock that had just posted its best session in over two years. The afterglow lasted about as long as it takes an underwriter to open a laptop. Funding the next two years of trials from a position of strength is sound capital management.
For anyone holding shares bought that morning, it is also the market handing back its own version of an integration session nobody asked to schedule, the part where you sit quietly and process what just happened to your cost basis.
The wide bands running beneath price the entire way up are the Triple Differential Moving Average Braid, three pairs of moving averages layered by horizon and color-coded so their relationship reads at a glance. The Royal Guard—the 50-day and 200-day EMA pair—holds the broader purple-magenta band beneath price, fast above slow without a single crossover since January, confirmation that the medium-term structure never once turned bearish underneath this climb. The Golden Section—the 50-day and 200-day SMA pair—sits beneath that in gold and tan, slower and more stubborn, doing the same job at the macro horizon and refusing to flip on anything the spring’s chop tried to throw at it. The thin, restless line weaving directly through the candle bodies, pulling away and crossing back every few sessions, is the Silver Thread, the fastest of the three, testing the trend’s patience repeatedly so the slower two layers never have to.
Three layers agreeing for five straight months without one of them breaking rank is the braid’s version of a unanimous jury, and the volume sitting underneath that agreement backs the verdict. Two quarterly Volume Profiles also appear. Q2’s quarterly volume memory essentially reset itself on the same day the gap happened, handing the breakout an unusually clean, unobstructed shelf to build its case on rather than a level still carrying Year-to-Date baggage.
Set and setting matters here too, even before any guide shows up to administer the next dose. A breakout arriving on top of a moving-average structure that never flipped, inside a volume shelf with little retracement potential from the prior quarter, is operating in a controlled environment with two independent sets of agreement already in place. Monday’s candle, several weeks later, would not be improvising in an empty room.
One Molecule, Two Diagnoses, And A Mission Statement Earning Its Keep
A single great trial result is a headline. A pipeline is what decides whether that headline becomes a pattern. DT120 already carries FDA Breakthrough Therapy Designation for generalized anxiety disorder, a separate Phase 3 program running independently of the EMERGE trial that just read out in depression. A second depression study, internally named Ascend, dosed its first patient on May 12, advancing in parallel rather than waiting for EMERGE to finish first. A second molecule, DT402, the R-enantiomer of MDMA, is working through Phase 2a for autism spectrum disorder, an earlier stage and a different diagnosis altogether. Such a portfolio spread keeps the company’s fortunes from resting on one outcome even when the market’s attention this week fixed entirely on the result large enough to move a stock half again in value.
The regulatory weather has been shifting in the same direction as the science. An April executive order directed the FDA and DEA toward better coordination on psychedelic drug development, including a provision letting DEA scheduling work begin once late-stage data exists rather than waiting on full approval. CEO Robert Barrow welcomed that specific provision as a likely efficiency gain for the company’s own timeline. The same month, three other psychedelic developers received expedited FDA review, evidence of a genuine sector tailwind rather than a single lucky break extended to one name.
None of this would matter without a balance sheet able to survive long enough to use it. Definium entered this week with roughly $373.4 million in cash against $40.77 million in debt and a guided runway into 2028 before any new financing arrived, the unglamorous foundation that everything more exciting in its pipeline has been quietly standing on the whole time.
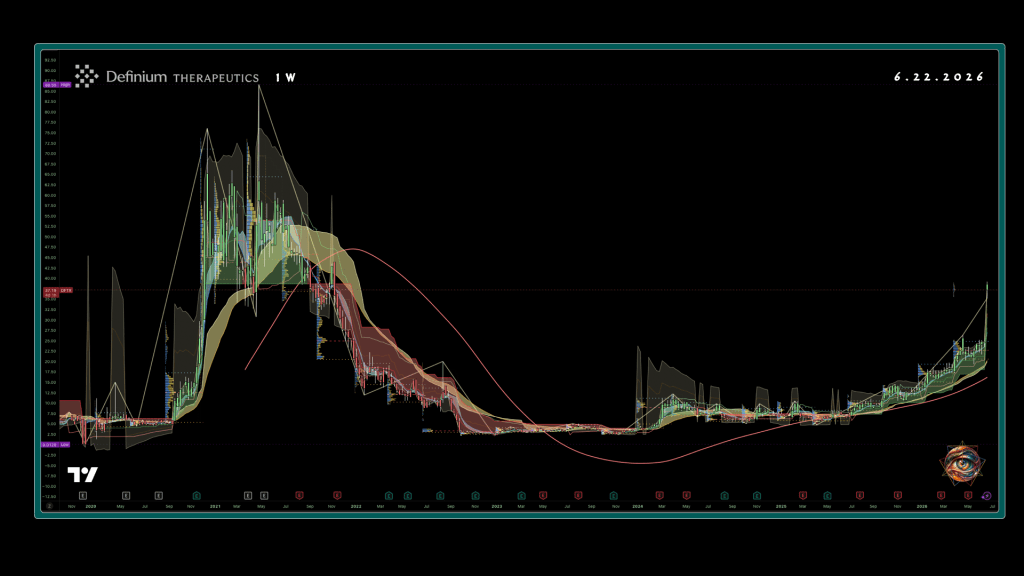
A macro filter that takes four years to even register doesn’t get reclaimed quietly; price has to spend weeks pressing against it before it gives way; and once it does, every faster layer underneath it inherits the same conviction it just confirmed. That’s the moment a balance sheet built to survive until 2028 stops being the whole story and the weekly chart’s faster rhythms start setting the pace instead. The climb that reclaimed the 200-week line left its own fingerprints on the way up, and those fingerprints are where the next read begins.
The zigzag’s swing skeleton tells the company’s whole survival story without a single word of biography: a sharp peak near the mania, a collapse to a low most charts never recover from, then a slow climb whose recent leg finally exceeds the multi-year basing range. Layered underneath it, the quarterly volume clusters thin to almost nothing through the 2022 and 2023 dead zone, then thicken steadily from 2024 forward, institutional participation returning roughly on schedule with the pipeline progress described above.
The Weekly MA Suite’s slowest layer makes the clearest statement of all. A 200-week Hull moving average needs the better part of four years of trading history before it can plot at all, and on this name, that requirement alone means the line only becomes operative somewhere in the 2023-to-2024 window, the same stretch where Ascend dosed its first patient and the regulatory tailwind began building. Price spent that entire window underneath it before finally reclaiming it on the way to this week’s close. A macro filter this patient agreeing with a balance sheet built to survive until 2028 is the chart’s own quiet way of saying the company’s recovery isn’t a story anyone had to take on faith.
Repeated Knocking Was The Signal, Not The Noise
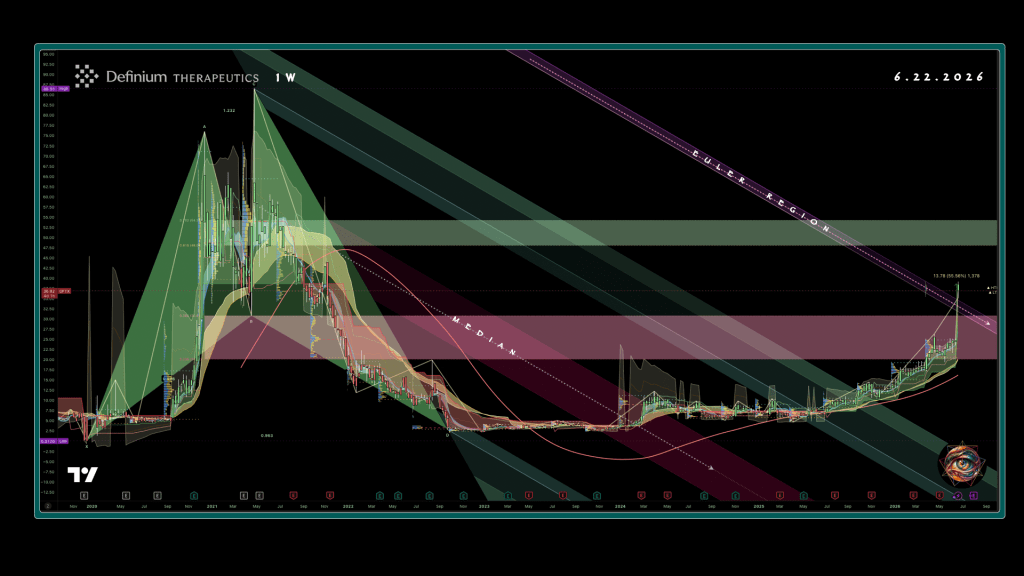
A pitchfork comprises three lines drawn from three swing points, a median running through the middle of a move and two outer rails set an equal distance to either side of it, the way a fork’s tines fan out from a single handle.
Most charting tools stop at a rail set to the move’s own width, one tine’s distance out, which catches an ordinary pullback but says nothing about a move large enough to outrun its own pattern entirely. Multiplying that distance by a ratio greater than one pushes the rail out past where price is expected to behave normally. Euler’s number, 2.718 is an unusual placement at first glance: large enough to mark genuine exhaustion rather than routine profit-taking, irrational enough that almost nobody else charting this name is drawing a line at the same spot. A rail set there isn’t predicting anything any more than an ordinary rail does.
It asks a sharper question than most indicators bother with-has this move traveled far enough to have spent itself completely?
The median line that flips this name from contested to confirmed isn’t a daily-chart artifact; it’s been running across the entire five-year history, labeled now in plain text rather than left for a careful eye to trace. It tells a longer story than the spring’s loading sequence ever could on its own. Price lost this line decisively in 2022, the small downward arrow marking the moment the decline turned structural rather than corrective, and didn’t reclaim it again until the climb building since 2024 finally caught up to its own slope. Five years between losing a line and getting it back isn’t a quick trade. It’s closer to a debt finally getting paid off in full, with interest attached.
The labeled Euler Region sitting well above current price, running from the high twenties into the thirties before climbing out toward triple digits by the chart’s far edge, is the same instrument the daily chart’s loading sequence has been quietly building toward all along, rendered at the scale that actually constructed it. The band’s slope, falling from a 2024 high near ninety-five down toward single digits by 2027, looks almost reckless next to the candles underneath it, until the upward arrow beside this week’s breakout makes the point plainly: price didn’t drift into that band, it arrived there in the same week the median finally gave way after five years of holding the line against it. Two structures agreeing across two timeframes stops being a coincidence worth hedging about once the dates line up this cleanly.
Apply plenty of caution to chasing sympathy in Cybin, Compass Pathways, or Atai. Each is running a chemically distinct molecule through its own trial design and its own endpoints, and one company’s win buys its peers a brief mood lift rather than a shared catalyst, a contact high with no actual dose behind it.
What actually explains the timing, once the mystique gets stripped away, is duller and more useful than any property of Euler’s number. A scheduled Phase 3 readout date is public information, and institutional desks position ahead of known binary events the way anyone plans around a date already circled on a calendar. That positioning produces exactly the kind of repeated, surviving contact with a median and a pair of rails that showed up here for weeks beforehand. The chart wasn’t tripping alongside the company. It had simply read the same protocol everyone with real money had already been handed.
A Single Dose Is The Whole Business Model
The same purple band labeled Euler Region on the weekly chart shows up here close enough to read its lettering, and the gap between it and the braid underneath has narrowed to something a single session can actually cross. Royal Guard and Golden Section are still running bullish beneath price, exactly as they were through the entire spring grind, and Silver Thread is still threading through the candles without a flip. None of that changed on the day this candle printed. What changed was the distance between where the braid’s territory ends and where the fork’s outer rail begins, a stretch of open air the chart had been slowly closing for weeks before finally clearing it in one motion.
Two completely different constructions are meeting on this exact candle. One is built from six moving averages tracking three separate cycle horizons, agreeing with itself for months at a time. The other is a single line set 2.718 standard deviations from a median that took five years to reclaim on the weekly chart. Neither tool knows the other exists, and neither was built with this stock’s trial calendar in mind, yet the candle that satisfies one also satisfies the other, arriving precisely where both, independently, said the real test would happen.
What the geometry can’t do is explain why the test was worth winning. A pitchfork rail and a moving-average braid can confirm that a move is structurally real, supported, and unlikely to be noise; they have nothing to say about what actually earned it.
Strip away the stock chart and one detail in this trial design deserves more attention than headline coverage has given it. DT120 produced its effect from a single 100-microgram dose, with benefit appearing inside the first week and holding for twelve, against a category where most existing options require daily pills, ongoing titration, and months of uncertainty before anyone can tell whether the medication is working at all. A treatment built around one supervised visit instead of ninety unsupervised mornings is not a minor convenience. For a healthcare system already straining under adherence problems, and for patients who have tried and failed several prior antidepressants before ever reaching a trial like this one, removing the daily-pill burden entirely is closer to a structural fix than a feature.
Breakthrough Therapy Designation, the regulatory status DT120 already holds for the anxiety indication, buys the company something concrete rather than symbolic. The status affords more frequent FDA touchpoints, eligibility for rolling review, and a faster path from data to filing than a standard program receives. Layered onto a single-dose protocol with this kind of effect size, the realistic benefit is specific rather than abstract, a treatment that could reach patients meaningfully faster than the category’s normal timeline allows, for a population that has historically waited the longest for anything that actually works.
The chart never saw the future. It just had a very good calendar app, and for one Monday in June, that turned out to be enough to make everyone holding a Fibonacci ruler look one news cycle behind the people holding an actual appointment book. Meanwhile, a molecule with a complicated cultural history just produced a dataset clean enough to make that history almost beside the point. What patients are being offered here is not a substance with a reputation, but a measured dose, a defined protocol, and a number on a clinical scale that moved further and faster than the drugs currently sitting on pharmacy shelves.

Leave a Reply